Dielectric Function of silver
This tutorial offers a study of optical dielectric function ε(ω) in silver. The system is relatively simple, and it provides a useful test bed to show what is captured by different levels of theory, and what is left out. We wil use the optics branch of lmf.
Experimentally, some quantities are accurately known: the DC conductivity is σ(ω=0) = 6.3×10⁷ (Ω-m)−1. Also it is well established that a sharp shoulder appears around 4 eV in the imaginary part of ε(ω).
Other quantities are also measured, but with less precision, as we discuss here.
Preliminaries
This tutorial uses several Questaal executables, e.g. blm, lmfa, lmf, pfit, plbnds, and fplot, and if you cover the GW part, the shell script lmgw.sh.
This tutorial assumes you have an 8-processor machine, with the Intel MKL library part of the compilation. We use the following shorthand as a launcher for jobs with 4 processes, and 2 threads.
mpix --omp=2 --mkl=2 -np=4
you can run in scalar mode, and simply ignore the launcher. Your machine may require details this tutorial cannot anticipate. A typical launch instruction would be
env OMP_NUM_THREADS=2 MKL_NUM_THREADS=2 mpirun -n 4
In this tutorial we will compute the dielectric function within the RPA, mostly with local fields. The optics branch in lmf will calculate Im εxx without local fields
Theory
For a local potential and neglecting local field effects, Im ε reads [4]
Here c and v refer to unoccupied and occupied states, respectively, and and the corresponding one-particle wave functions with eigenvalues and ; is the unit vector, and is the momentum operator.
For an insulator, c and v span the unoccupied and occupied states, respectively. In the metals case we consider here, bands cross the Fermi level so c and v are not cleanly separated. This is taken into account by including the difference in Fermi functions , and c and v now span all states.
If a nonlocal potential is added to the local one, the velocity operator should replace . However, if the nonlocal potential is diagonal in the band basis of the local potential, it does not change and . In such a case it can be shown [4] that an effective momentum operator may be used instead, which is written as
Energies in the numerator and denominator correspond to whether the nonlocal potential is included or not, respectively. You can use this correction factor by setting MEFAC=2 in OPTIONS. We will do this in the present tutorial, when optics are calculated using lmf with the QSGW self-energy.
In the metallic case we must distinguish intraband and interband transitions. The former is a transition with an infinitesimal energy changes from an occupied state to an occupied state of the same band at the Fermi level EF, while the latter are transitions between different bands. lmf’s optics branch takes into account only interband transitions. When the two are separated the total dielectric function becomes . The GW optics computes for a small but finite wave number q, and thus there is no separation.
. is called the “plasma frequency”. It can be interpreted as the physical plasma frequency (frequency of collective oscillations), but the usual construction only takes into account the intraband contribution, and corresponds only approximately to the physical plasma frequency.
Traditionally is taken to be a scalar, but the intraband contribution was recently rederived [5] specifically to discuss its tensorial nature. It can be written as
with the usual plasma frequency defined as
lmf has the ability to compute in its tensorial form, as we show below. Since Ag is cubic, is a scalar, and the tensorial nature doesn’t matter here.
Scattering mechanisms are another important omission. Scattering can occur in part from electron-electron scattering, but also from phonons (phonons are usually the dominant ones). Scattering mostly modifies the intraband contribution. The intraband contribution has the same form as the Drude model. When this model includes a relaxation time , [6]. We use the Drude model to modify the intraband contribution as
Calculation of is highly nontrivial. Here we will use an experimental value for it instead.
lmf computes Im ε only. However the real part can be derived from it via a Kramers Kronig transformation
The KK transformation connects the real and imaginary parts of any complex function that is analytic in the upper half-plane; the dielectric function and conductivity are two instances of this. Questaal has a code, kkt, which obtain the real part from the imaginary part by calculating the Hilbert transform shown in the preceding equation.
Finally, to compare to experiment we will use the well known relation between dielectric function and conductivity
Thus the real part of the intra-atomic (Drude) contribution to is
Tutorial
Ag assumes an fcc sublattice. Copy the box below to init.ag, which takes the room temperature lattice constant.
LATTICE
   ALAT=7.720 PLAT= -0.0 0.5 0.5  0.5 -0.0 0.5  0.5 0.5 -0.0
SITE
   ATOM=Ag  X=0 0 0
Create a ctrl file and a symmetry lines file
blm --brief --rsham~el=-.4,-1.2 --upcase --nfile --optics  --gw~emax=3~nk=8 --nk=12  ag
sed -i.bak s:'NPTS=1001 WINDOW=0,1':'NPTS=3001 WINDOW=0,5 DW=0.002,0.02':g ctrl.ag
The first line makes a ctrl file. The second line modifies tokens in the OPTICS category to span a wider window than the default values blm supplies.
Get the free atom density and make Ag self-consistent at the LDA level
lmfa ag
mpix --omp=2 --mkl=2 -np=4 lmf ag
cp rst.ag rst.lda
Next, calculate the optics with lmf. Note in the ctrl file, the MODE token is controlled by variable loptic, which makes it possible to turn on the optics part through the command line
mpix --omp=2 --mkl=2 -np=4 lmf ag -vnkabc=24 -vloptic=1 --quit=rho

This should invoke lmf’s dielectric function maker. You should see this block in the output
 OPTINT:  eps2(w) using occ bands (1,30) and unocc (1,30)
          3001 points in energy window (0,5)
          Ef=-0.117188  Treating bands as metal
          Integration with tetrahedron method, mode 1
and opt.ag should be generated. It has four columns: frequency (in Ry), followed by Im εxx, Im εyy, and Im εzz. Ag is cubic so they are all equivalent.
Plot Im εxx with fplot -x 0,12 -ab 'x1*13.6' opt.ag, or use your favorite graphics package. The fplot instruction converts the x axis to eV. and generates the figure shown.
Experimental data can be found in Refs [1,2,3]. We will use Ref. [3] as the benchmark because it is the most recent, and the samples are thought to be better.
Several observations are noteworthy here:
- Im ε vanishes identically below 2 eV, contrary to experiment; see Ref. [3], Fig. 4. Since the DC conductivity σ(ω=0) is related to Im ε(0), it implies σ(ω=0) vanishes. This is because the scattering mechanisms (especially electron-phonon scattering) have been left out. Remarkably, scattering is needed if the D.C. conductivity is not to vanish.
- A sharp shoulder begins a little below 3 eV with the midpoint of the rise close to 3 eV. This shoulder is observed experimentally, with the midpoint at ∼4 eV. The shoulder originates from transitions between the filled Ag d bands and the sp like bands around and above EF. The rise starts too soon in the calculation, because the LDA puts the Ag d states too shallow. This will be revisited in the QSGW section.
- The peak value of Im ε is about 6, and it falls off to 2 at about 7 eV. In Ref. [3] its peak value is ∼4.
kkt will yield Re ε from Im ε.
kkt opt.ag
It writes to kk.out by default, which contains Re ε and Im ε side by side. Inspect the file and observed that ε∞=Re ε(ω=0)≈4.1. A precise experimental determination of this quantity is difficult because it is buried in the (divergent) Drude term. the scattering time and plasma frequency have been variously reported, with similar uncertainties.
For experimental benchmark we will use the following estimates reported in Ref. [3]: .
Re ε(ω) diverges as , owing to the intraband term (see theory section). is also difficult to pin down precisely experimentally, but values between 8.5 and 9.5 have been published (see Table 1 of Ref.[5]). The expression for described in the theory section has been implemented Questaal; to calculate it, do the following
mpix --omp=2 --mkl=2 -np=4 lmf ag -vnkabc=72 --quit=rho
lmdos ag -vnkabc=72 --dos~wp
(A conservative k mesh was used to avoid the need to monitor convergence.)
You should see the following printed to stdout:
 Plasma tensor at Ef=-0.117834 Ry  (Tr(wp^2)/3)^1/2 = 9.098 eV
              Dij (Ry^2)                           Dij (eV^2)
   0.447120   0.000000   0.000000        82.76848    0.00000    0.00000
   0.000000   0.447120   0.000000         0.00000   82.76848    0.00000
   0.000000   0.000000   0.447120         0.00000    0.00000   82.76848
Thus lmf predicts a very reasonable value for . It is slightly less than that reported in Ref. [3], presumably because of the pseudopotential approximation they use.
kkt also implements the intraband term modified by as describe in the theory section. Invoke it as follows
kkt -outfile=eps.lda -units:out=ev -wp=9.1/13.6,235 -cnvtmid -skip0=2 opt.ag
-wp=9.1/13.6,235 tells kkt to add a Drude term with Ry (you must supply this quantity in Ry). The second number is a dimensionless quantity : note that . -cnvtmid tells kkt to treat the frequencies as a histogram with the response function the value at the center of each histogram. It doesn’t matter much, but for small it makes a little difference. Finally, since the KK algorithm has difficulty stabilizing the transformation very near the origin, the first two energies are omitted (-skip0=2).
Inspect eps.lda. Comparing to Fig. 6 of Ref. [3], the agreement is seen to be very good. Both fall off as (in this regime is already much larger than 1). At and , and 3, respectively. These are essentially the same values in Fig. 6 of Ref. [3], confirming that the Drude model works well. (To draw a figure that compare with Fig. 6, try something like fplot -frme:lxy 0,1,0,1 -x .05,1 -y 1,10000 -ord x3 eps.lda.)
Generating conductivity from dielectric function
Eq. [7] in the theory section shows the simple relation between and You can tell kkt to write instead of by adding a switch -out=cond. If further you want to write in more standard units, it will write in units 106 (ohm-m)−1 with -out=cond~units=ohmm, viz:
kkt -outfile=sig.lda -units:out=ev -wp=9.1/13.6,235 -cnvtmid -skip0=2 out=cond~units=ohmm opt.ag
To convert to MKS units, kkt uses a factor of 2.3. To derive the conversion factor, use the conductance quantum ohm-1. Also, where in atomic units. This implies
(ohm-m)-1 = (ohm-m)-1.
The DC conductivity
To compare to the DC σ we can read off from Eq. [8] in theory section. Then
Expressed in SI units (ohm-m)-1. This is a factor of two smaller than the experimental value, (ohm-m)-1. The discrepancy means that at very low frequency some modification of the Drude model is needed. Ref. [3] folded the discrepancy into an energy-dependent relaxation time, approximately frequency independent for constant above 0.1 eV, but increasing by a factor of ∼2 approaching 0 from the flat region (see Fig. 10 of Ref. [3].)
How QSGW modifies the conclusions
We noted that the shoulder rises at too low a frequency because the LDA does a poor job at placing the Ag d states. In this section we will make the QSGW self-energy and revisit the preceding section
First, make the LDA bands
lmchk ctrl.ag --syml~n=50~lblq:G=0,0,0,L=1/2,1/2,1/2,X=1,0,0,W=1,1/2,0,K=3/4,3/4,0~lbl=LGXWGK
mpix --omp=2 --mkl=2 -np=4 lmf ag -vnkabc=24 --quit=rho
mpix --omp=2 --mkl=2 -np=4 lmf ag -vnkabc=24 --band:fn=syml
plbnds -range=-8,6 -fplot~scl=.7~sh~ts=1 -ef=0 -scl=13.6 -dat=lda bnds.ag
Plot the bands with fplot -f plot.plbnds, or use your favorite graphics package. The Ag d bands lie in the interval (−6,−3) eV.
Note that files bnds[12345].dat were created. We will use these files later, to compare against QSGW.
To run QSGW, we need to create the GWinput file. While we are at it, we can make the pqmap file, so the code runs faster.
lmfgwd -vsig=0 ctrl.ag --job=-1
lmfgwd -vsig=0 ctrl.ag --job=0 --lmqp~rdgwin --batch~np=8~nplm=16~npgwd=16~nodes=1~pqmap@fill=.8@plot~vanilla16
Now we are ready to run lmgw.sh to create the QSGW self-energy.
lmgw.sh --incount --sym --tol=1e-5 --split-w0 --mpirun-1 "env OMP_NUM_THREADS=2 MKL_NUM_THREADS=2 mpirun -n 1" --mpirun-n "env OMP_NUM_THREADS=2 MKL_NUM_THREADS=2 mpirun -n 4" ctrl.ag
Note: you may need to modify --mpirun-1 and --mpirun-n depending on your architecture.

First, make and plot the QSGW bands
mpix --omp=2 --mkl=2 -np=4 lmf ag -vnkabc=24 --quit=rho
mpix --omp=2 --mkl=2 -np=4 lmf ag -vnkabc=24 --band:fn=syml
plbnds -range=-8,6 -fplot~scl=.7~sh~ts=1 -ef=0 -scl=13.6 -dat=qsgw bnds.ag
Plot the bands with fplot -f plot.plbnds, or use your favorite graphics package. You can confirm that the Ag d bands are deeper by ∼1 eV than the LDA, in the interval (−3,−7) eV. The figure on the left draws both the LDA bands (red) and the QSGW bands (blue), together with some ARPES data (circles).
We can repeat the other parts also. Excluding the Drude term
mpix --omp=2 --mkl=2 -np=4 lmf ag -vnkabc=24 -vloptic=1 --quit=rho
kkt opt.ag
shows that QSGW causes ε∞ to drop from 4.0 to 3.3. Both agree with observed data within the experimental uncertainty.
The plasma frequency is also slightly modified.
mpix --omp=2 --mkl=2 -np=4 lmf ag -vnkabc=72 --quit=rho
lmdos ag -vnkabc=72 --dos~wp
increases from 9.1 to 9.5, slightly larger than the LDA result.
kkt -outfile=eps.qsgw -units:out=ev -wp=9.5/13.6,245 -cnvtmid -skip0=2 opt.ag
 Not surprisingly, the low-frequency behavior of is very similar, since the same Drude term is used for both and and are both similar. Over a broader window, the QSGW response function compares very well with experiment. The following plots for both LDA (red) and QSGW (blue), and was used to generate the image shown:
fplot -x .5,10 -y 0,8 -lt 2,col=1,0,0 -ord x3 eps.lda -ord x3 -lt 1,col=0,0,1 eps.qsgw
You can also generate the reflectivity.
kkt -outfile=refl.qsgw -units:out=ev -wp=9.5/13.6,245 -cnvtmid -skip0=2 -out=refl opt.ag
fplot -x 0,5 refl.qsgw
You should see a figure quite similar to that of Fig. 8 in Ref. [3], falling sharply from 1 slightly above 3 eV., reaching a minimum at just under 4 eV.
Comparing dielectric functions calculated by the GW code and by lmf
The QSGW code calculates the dielectric function for finite wave number q, with and without local fields. We seek the q→0 limit, which we accomplish approximately with a small value of q along the x axis. q and the frequency mesh are supplied in the OPTICS category of the ctrl file, with the tags EPSQ=0,0,0.015 DELRE= 0.002 0.02. Because q is nonzero, the optics will pick up the intraband term, but with no scattering, and also frquencies below q·v_F are not picked up; thus below some cutoff should be ignored.
To obtain the optics, do something like the following (details will depend on your architecture)
touch meta bz.h5
rm -r meta *.h5
m1="env OMP_NUM_THREADS=8 MKL_NUM_THREADS=8 mpirun -n 1"
mn="env OMP_NUM_THREADS=2 MKL_NUM_THREADS=2 mpirun -n 4"
ml="env OMP_NUM_THREADS=1 MKL_NUM_THREADS=1 mpirun -n 8"
md="env OMP_NUM_THREADS=1 MKL_NUM_THREADS=1 mpirun -n 8"
mc="env OMP_NUM_THREADS=4 MKL_NUM_THREADS=4 mpirun -n 2"
lmgw.sh -vnkgw=24 --epsq --mpirun-1 "$m1" --mpirun-n "$mn" --cmd-lm "$ml" --cmd-gd "$md" --cmd-vc "$mc" --split-w0 --tol=2e-5 ctrl.ag
This script should generate eps.h5. Inspect it with h5ls eps.h5 and you should see this:
eps                      Dataset {1, 298}
eps_nlfc                 Dataset {1, 298}
freq                     Dataset {298}
nfreq                    Dataset {1}
nq                       Dataset {1}
q                        Dataset {1, 3}
To retrieve in the same format as above, do the following
mcx '-ff12.6,100(f20.12)' -r:h5~id=freq eps.h5 -s13.6 -r:h5~z~id=eps eps.h5 -real -r:h5~z~id=eps eps.h5 -s0,-1 -real -ccat -ccat > dat-24
Here we used a q mesh of 24 divisions. You can check convergence in the mesh by changing -vnkabc=24.
Note that below 0.25 eV, becomes sharply positive, and turns around and becomes positive. Thus 0.25 eV is the cutoff just referred to. To remove this part, rework the mcx command:
mcx '-ff12.6,100(f20.12)' -r:h5~id=freq eps.h5 -s13.6 -r:h5~z~id=eps eps.h5 -real -r:h5~z~id=eps eps.h5 -s0,-1 -real -ccat -ccat -inc 'x1>0.25' > dat-24
Compare as generated by lmf to the QSGW result. For an apples-to-apples comparison we need to remove the scattering from the Drude term. We also skip the first few points where the QSGW result is inapplicable.
kkt -outfile=eps.qsgw0 -units:out=ev -wp=9.5/13 -cnvtmid -skip0=10 opt.ag
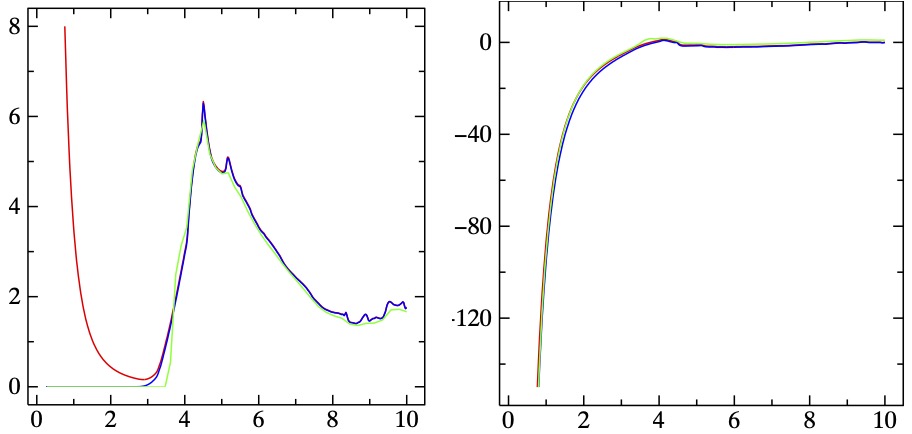
Draw a figure of calculated by : lmf with both and (red), lmf with only (blue), and by QSGW (green)
fplot -x .25,10 -y 0,8 -ord x3 -lt 1,col=1,0,0 eps.qsgw -ord x3 -lt 1,col=0,0,1 eps.qsgw0 -ord x3 -lt 1,col=0,1,0 dat-24
You should see a figure very similar to the one shown on the left. It is also useful to compare :
fplot -x .25,10 -y -150,10 -ord x2 -lt 1,col=1,0,0 eps.qsgw -ord x2 -lt 1,col=0,0,1 eps.qsgw0 -ord x2 -lt 1,col=0,1,0 dat-24
You should see a figure very similar to the figure on the right.
Both and are similar between all three calculations, but there are differences, which can be summarized as follows:
- lmf uses the momentum operator for matrix elements, scaled by the correction Eq. [2] in the theory section, while the QSGW optics evalues matrix elements of , with a small q.
- lmf does not pick up the intra-atomic term, but it can be added by a separate determination of , via kkt.
- GW optics picks up both intra and interatomic terms, but without scattering and valid only above a cutoff frequency.
- The intra-atomic term calculated by two different ways are nearly identical.
- GW optics includes nonlocal field effects, while lmf does not.
- The scattering has a marked effect on , but differences are much less noticable for . This is because is independent of once , while is proportional to .
- lmf neglects local fields.
References
[1] P. B. Johnson and R. W. Christy. Optical Constants of the Noble Metals. Phys. Rev. B 6, 4370 (1972)
[2] E.D. Palik and G. Ghosh. Handbook of optical constants of solids. Academic Press, 1998.
[3] Honghua U. Yang, Jeffrey D’Archangel, Michael L. Sundheimer, Eric Tucker, Glenn D. Boreman, and Markus B. Raschke, Optical dielectric function of silver. Phys. Rev. B 91, 235137 (2015)
[4] R. Del Sole and Raffaello Girlanda, Optical properties of semiconductors within the independent-quasiparticle approximation, Phys. Rev. B 48, 11789 (1993).
[5] Bernardo S. Mendoza and W. Luis Mochán, Ab initio theory of the Drude plasma frequency. J. Opt. Soc. Am. B 38, 1918-1926 (2021).
[6] Michael Marder, Condensed Matter Physics. John Wiley & Sons. DOI 10.1002/9780470949955. See Eqn 23.25.