Examples
Spin-Entangled Optical Excitations in van der Waals Antiferromagnets
MnPS3 and NiPS3 are layered antiferromagnets, with most of the bonding occurning within a layer in the ab plane, and weak van der Waals interactions between layers. Both exhibit multiple subgap absorption peaks, which originate from internal d-d transitions on the transition metal. One peak has a particularly sharp resonance. Through a combination of theory and photoluminesence measurements under an applied magnetic field, a recent work, published in Advanced Science, identified this resonance as a spin-flip exciton, meaning that the spin of the system changes by ΔS=1 when the exciton is created or emitted. This transition is of particular interest because it is extremely sharp, which makes it attractive for electro-optic devices because its ultranarrow bandwidth opens the possibiity for device operation with long lifetime and low loss.
To interpret the excitons it is necessary to first explain the one-particle electronic structure. MnPS3 and NiPS3 have similar crystal structures as shown in Fig. 1.
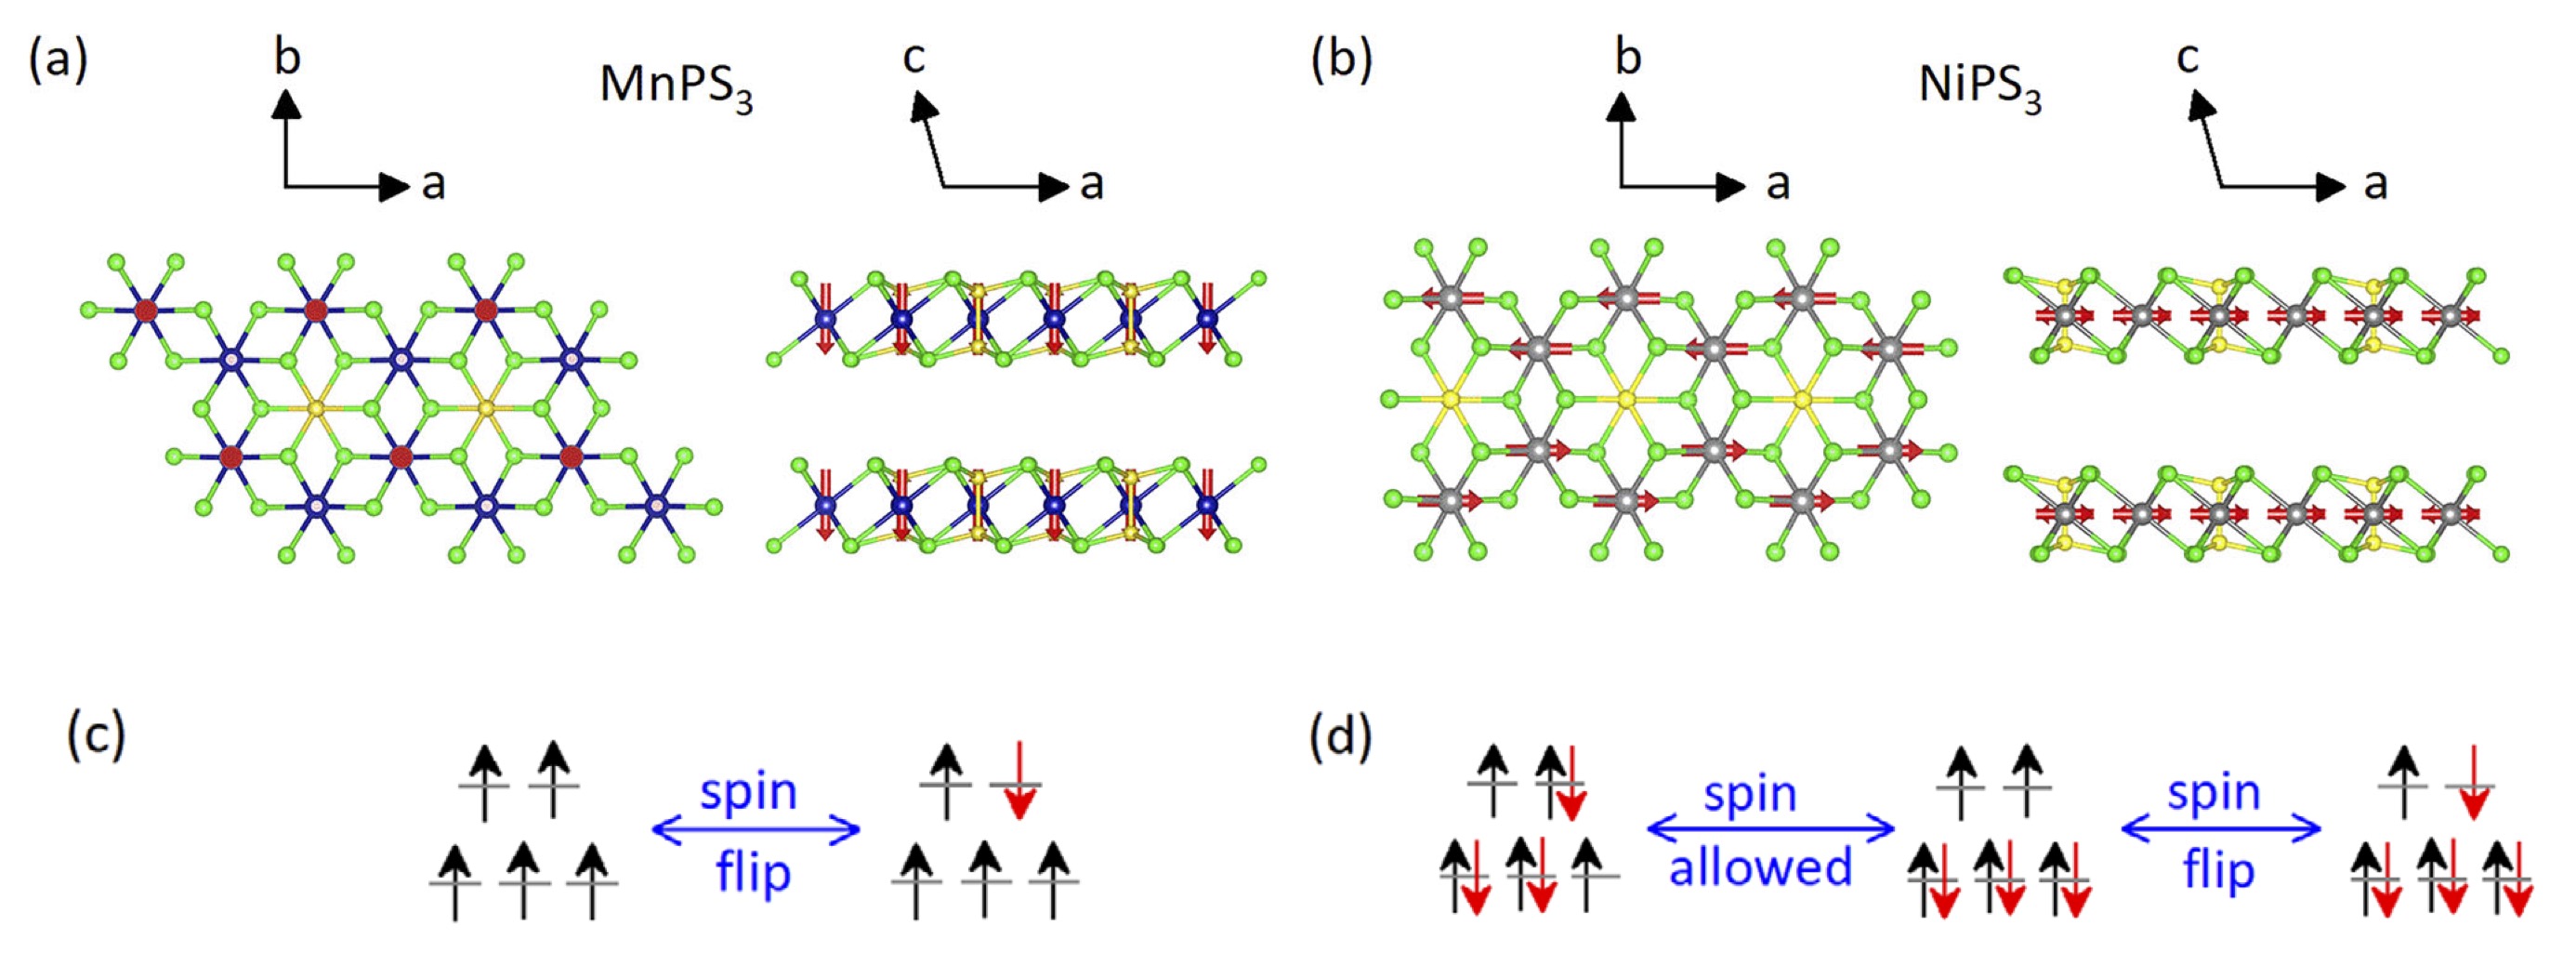 Fig. 1. (a) lattice structure of MnPS3 in the ab plane, and a side view normal to the plane. (b) Same for NiPS3. Blue/gray/ green/yellow spheres represent manganese/nickel/ sulfur/phosphorus atoms. Panels (c) and (d) show the spin configuration before and after a d-d excitation.
The magnetic structure is depicted in Fig. 1 as red arrows. While both compounds are antiferromagnetic (AFM), the spins are aligned perpendicular to the plane for MnPS3, and in the plane for NiPS3. By applying fields both in-plane and out-of-plane we can extract the exchange interactions J and magnetocrystalline anisotropy D, as we show below). The magnetic configurations differ in another important respect. The Mn d shell takes a d 5 configuration: thus its majority-spin d states are filled while its minority states are empty. This implies that there can be no transition between occupied and unoccupied d states without a spin flip (Fig 1c). Ni takes a d 8 configuration, with all 6 t2g states in the two spin channels filled, and the remaining eg state filled in one channel but empty in the other (Fig 1d). This configuration admits both spin-conserving transitions and spin-flip transitions. As the Mn moment is approximately 5, while the Ni moment is close to 2, Mn has a larger internal effective magnetic field, so the Zeeman splitting between occupied and unoccupied states is much larger. Roughly the occupied-unoccupied splitting is given by I×M, where I is the Stoner parameter (about 1 eV in 3d transition metals) and M the magnetic moment. This is reflected in the band structure and density-of-states (Fig. 2). They are calculated within a self-consistent form of ab initio many-body perturbation theory, using the quasi-particle self-consistent GŴ approximation (QSGŴ). QSGŴ is an extension of the quasi-particle self-consistent GW approximation (QSGW) where electronic eigenfunctions are computed in the presence of the screened Coulomb interaction corrected by the excitonic vertex. QSGŴ generally yields very accurate one-particle spectra, so this theory is expected to provide a reliable estimate for the one-particle gap.
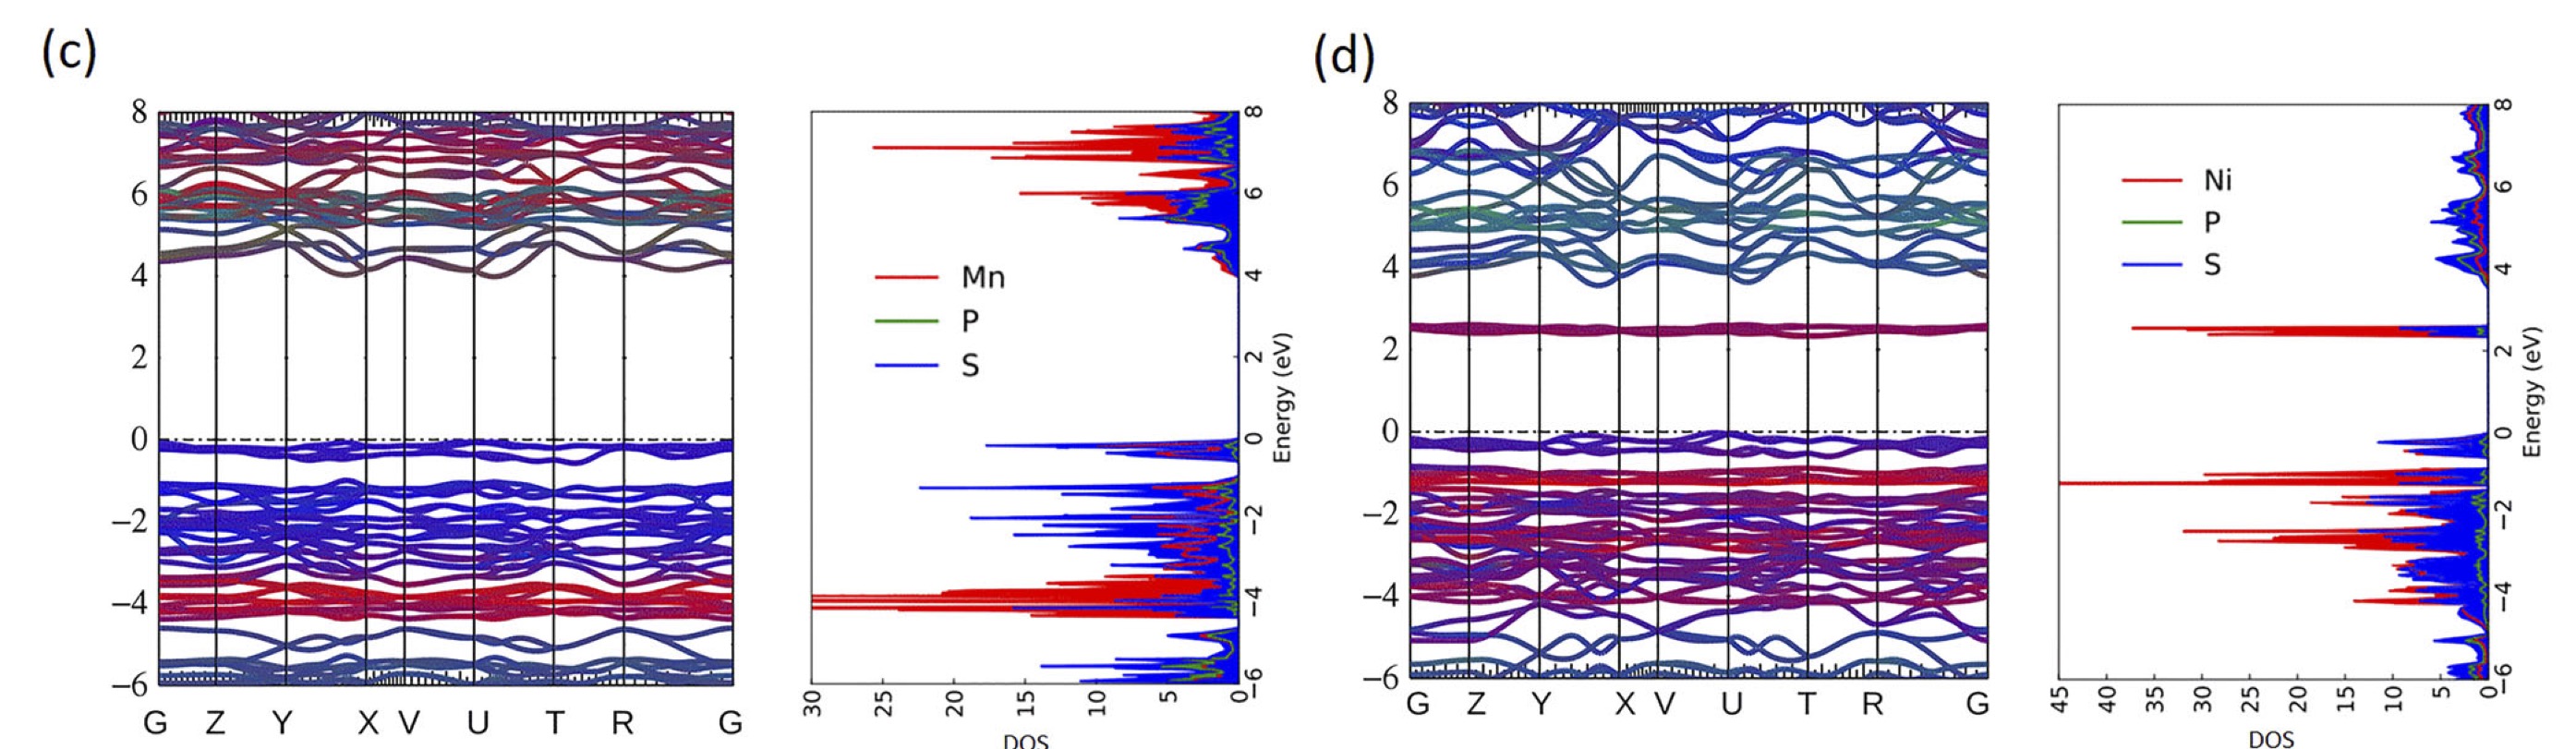 Fig. 2. (a) Energy-band structure for MnPS3 and corresponding density-of-states. The Fermi level is at 0. (b) Same for NiPS3. Splitting between occupied and unoccupied d states is much larger in MnPS3 than in NiPS3.
We are now ready to interpret the photoluminesence in MnPS3 and NiPS3 in terms of excitons predicted from QSGŴ, and from a dynamical mean field theory extension of QSGŴ. This latter is needed because low-order many-body perturbation theory such as QSGŴ yields only spin-conserving transitions (ΔS=0), while DMFT (which includes all local diagrams) can account for spin flip transitions.
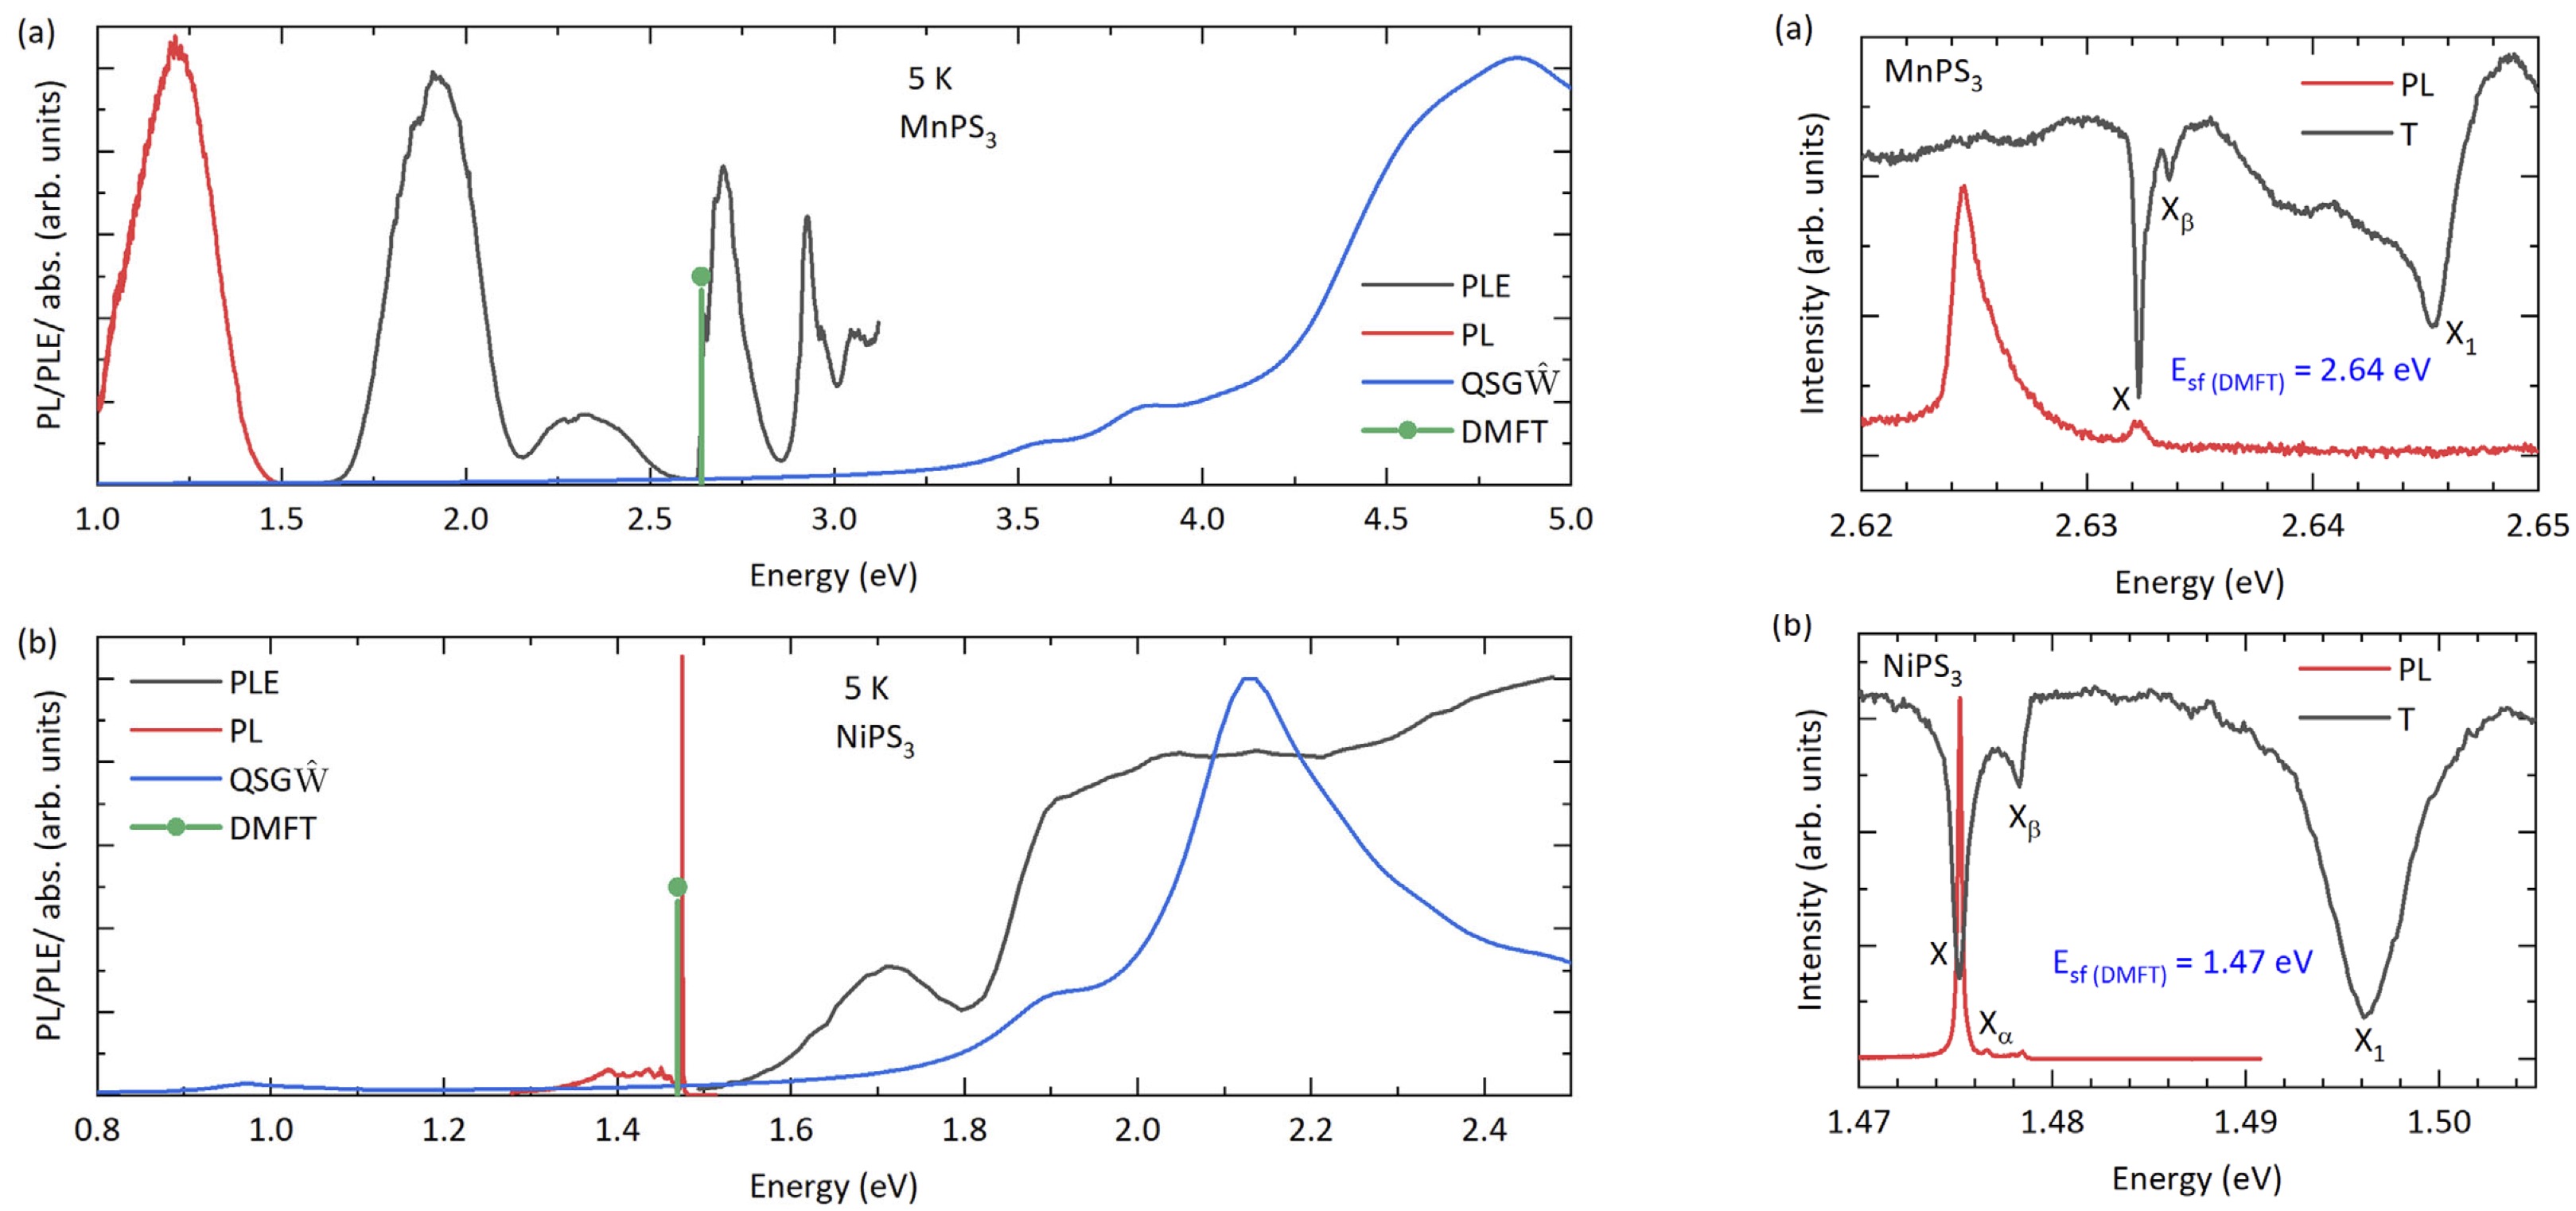 Fig. 3. Photoluminesence and photoluminesence excitation spectra, together with dielectric response computed within MBPT and DMFT. Top and bottom panels are for MnPS3 and NiPS3, respectively. Left: over a wide energy window; Right: a small window focusing on the sharp peak that we identify as a spin-flip transition.
Figure 3 compares the PL response to the theoretical dielectric function computed from QSGŴ. (PL and dielectric response are related but different quantities, so the comparison is not direct.) The key thing to note is that MBPT shows no response below 3 eV (transitions above 3 eV derive from transitions across the bandgap, not d-d transitions). Also, the sharp peak is not captured in either compound. The reason for this was noted earlier: low-order MBPT does not have a spin flip transition, while DMFT allows it (green circle).
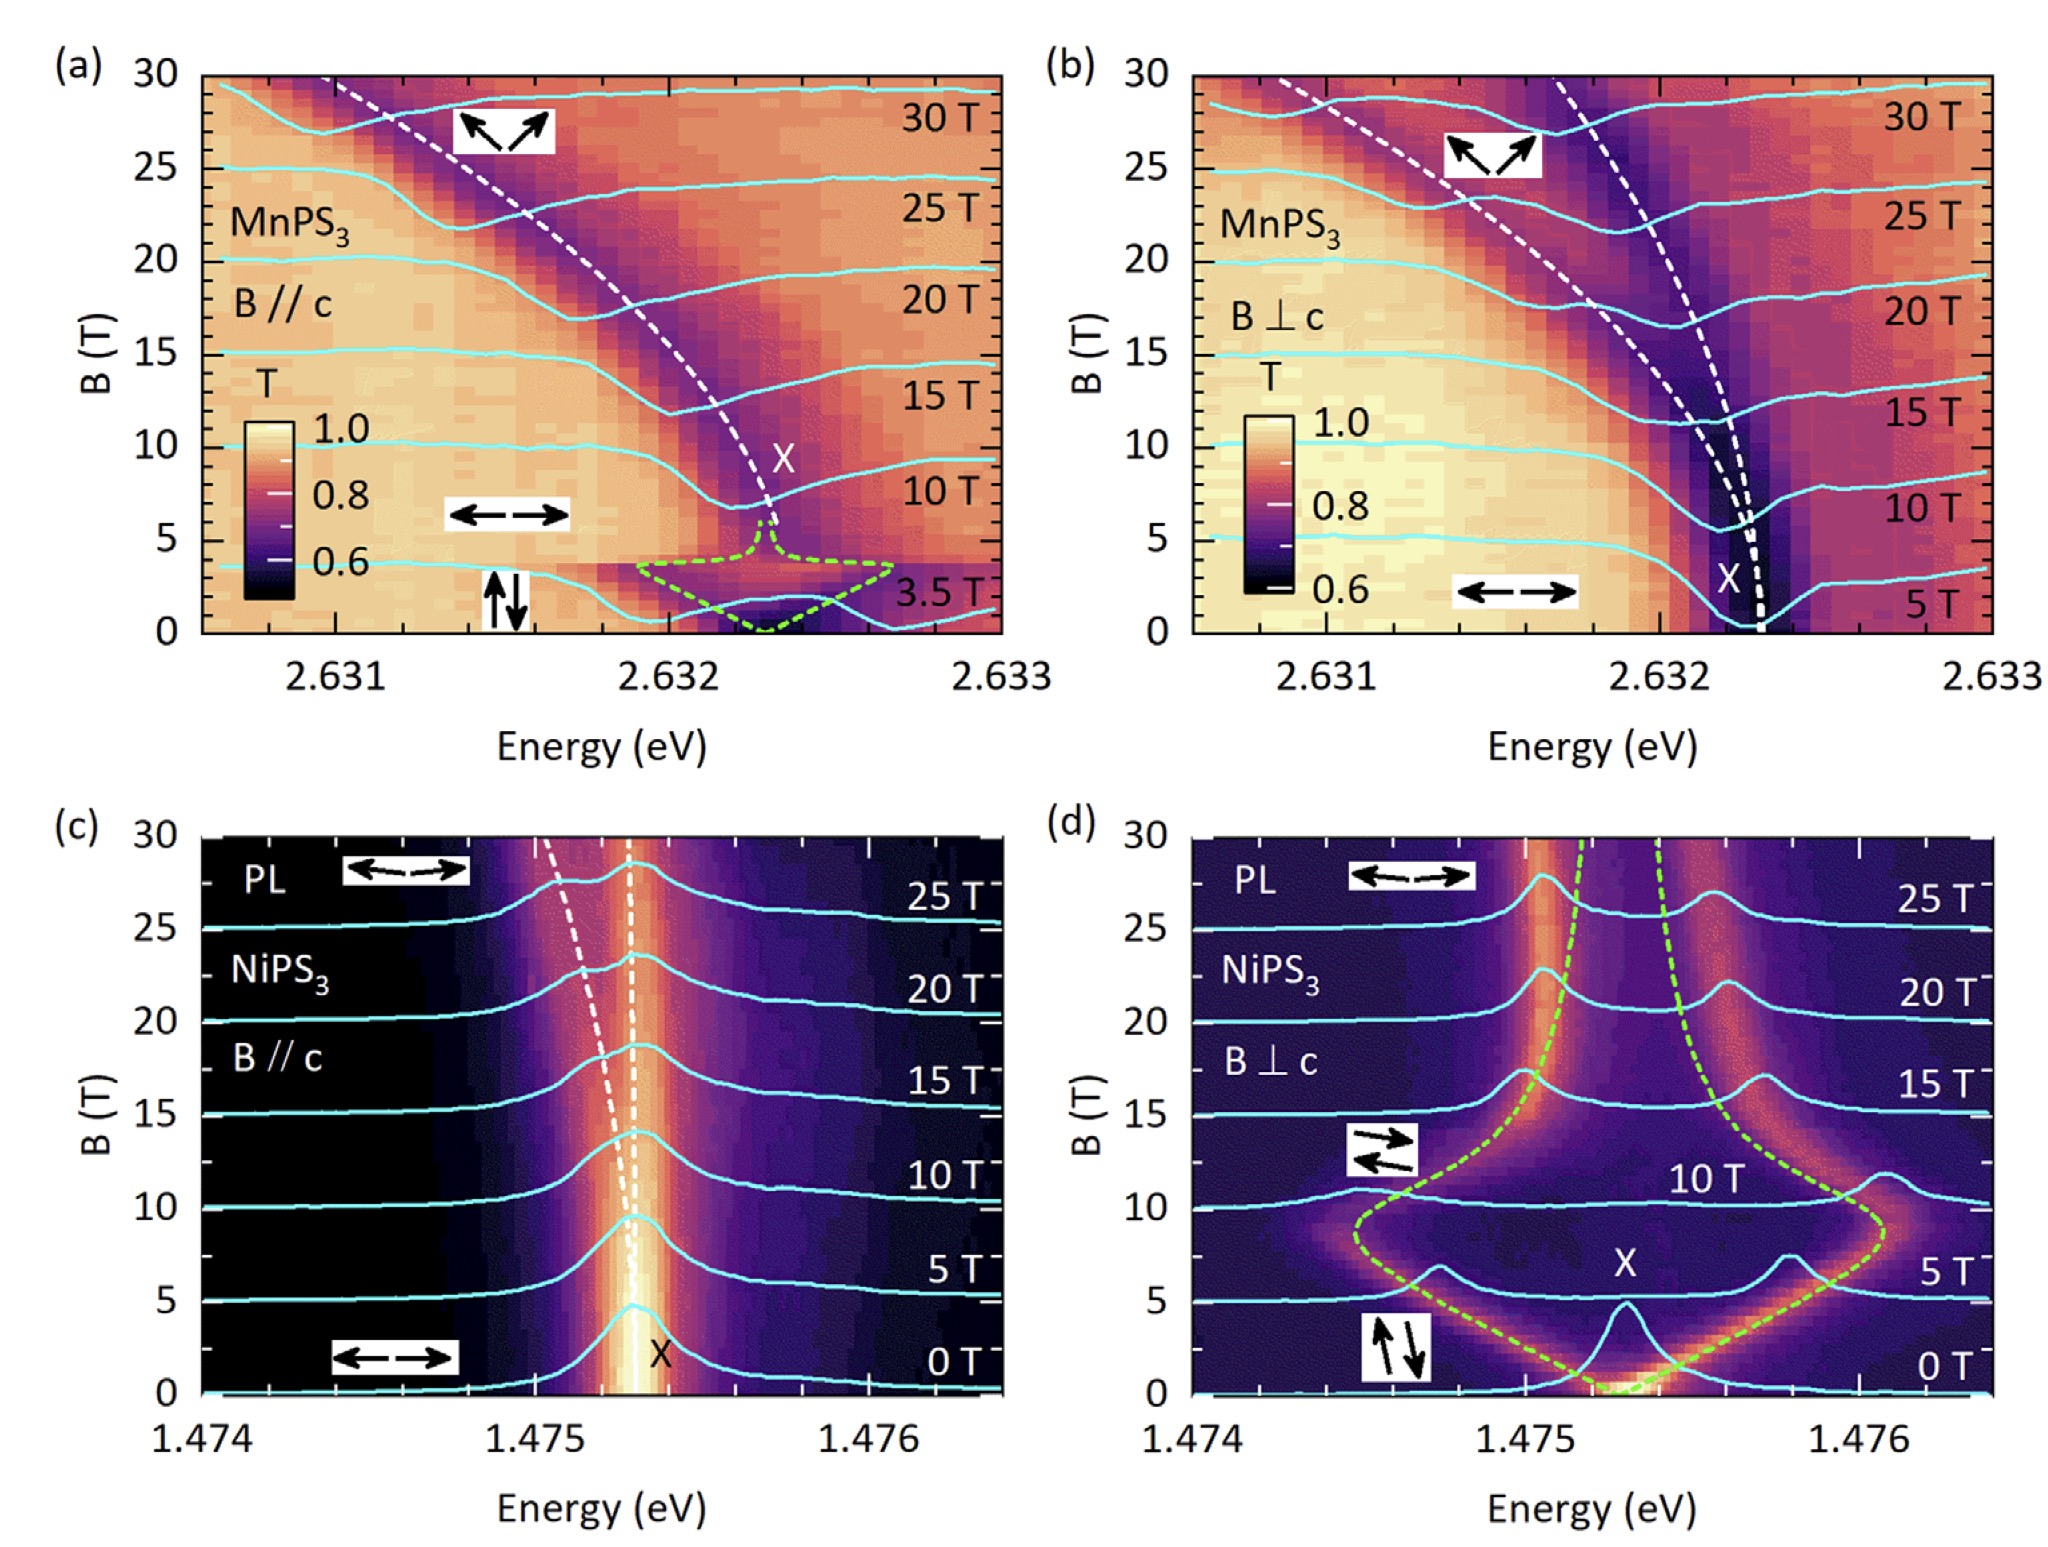 Fig. 4. Heat map of the change PL intensity with application of a magnetic-field B. The shift in peak intensity is indicated by the dashed white line. Left figures are drawn for B normal to the plane; right for B in plane. Top figures are for MnPS3, and bottom ones are for NiPS3. Note that panels (a) and (d) the field is parallel to the 0-field magnetization, while B is perpendicular to it. The small insets with the arrows show how the magnetization evolves with B in the various cases.
Figure 4 provides some experimental confirmation of this picture. Applying a field B, either perpendicular or parallel to the magnetization, causes the spins to cant as shown by the insets in the Figure. The shift in the exciton peak can be well described by a simple model using a Zeeman field for the shift
Ex(B) = Ex(0) − g μB B cos(Ψ(B))
Here g is the Landé g-factor, μB is Bohr magneton, and Ψ(B) is the angle between the direction of a magnetic field and spin axis of the sublattices. This model should apply if the anisotropy D is small compared to the exchange coupling J. Both D and J can be extracted from the data in the Figure using a simple model for the spin hamiltonian. The interested reader is referred to the original paper for details.
PAPERS · EXCITONS · 2D MAGNETS