Examples
Origin of Metal-Insulator Transition in RNiO3
Acharya et al., Computational Materials Today, 2026
National Laboratory of the Rockies · King’s College London · Daresbury Labs
A recent work published in Computational Materials Today investigates the fundamental physical mechanisms behind the metal-insulator transition (MIT) in rare-earth nickelates (R-NiO3). It resolves a long-standing debate over whether the MIT is primarily driven by structural distortions of the crystal lattice or by electronic/magnetic instabilities.
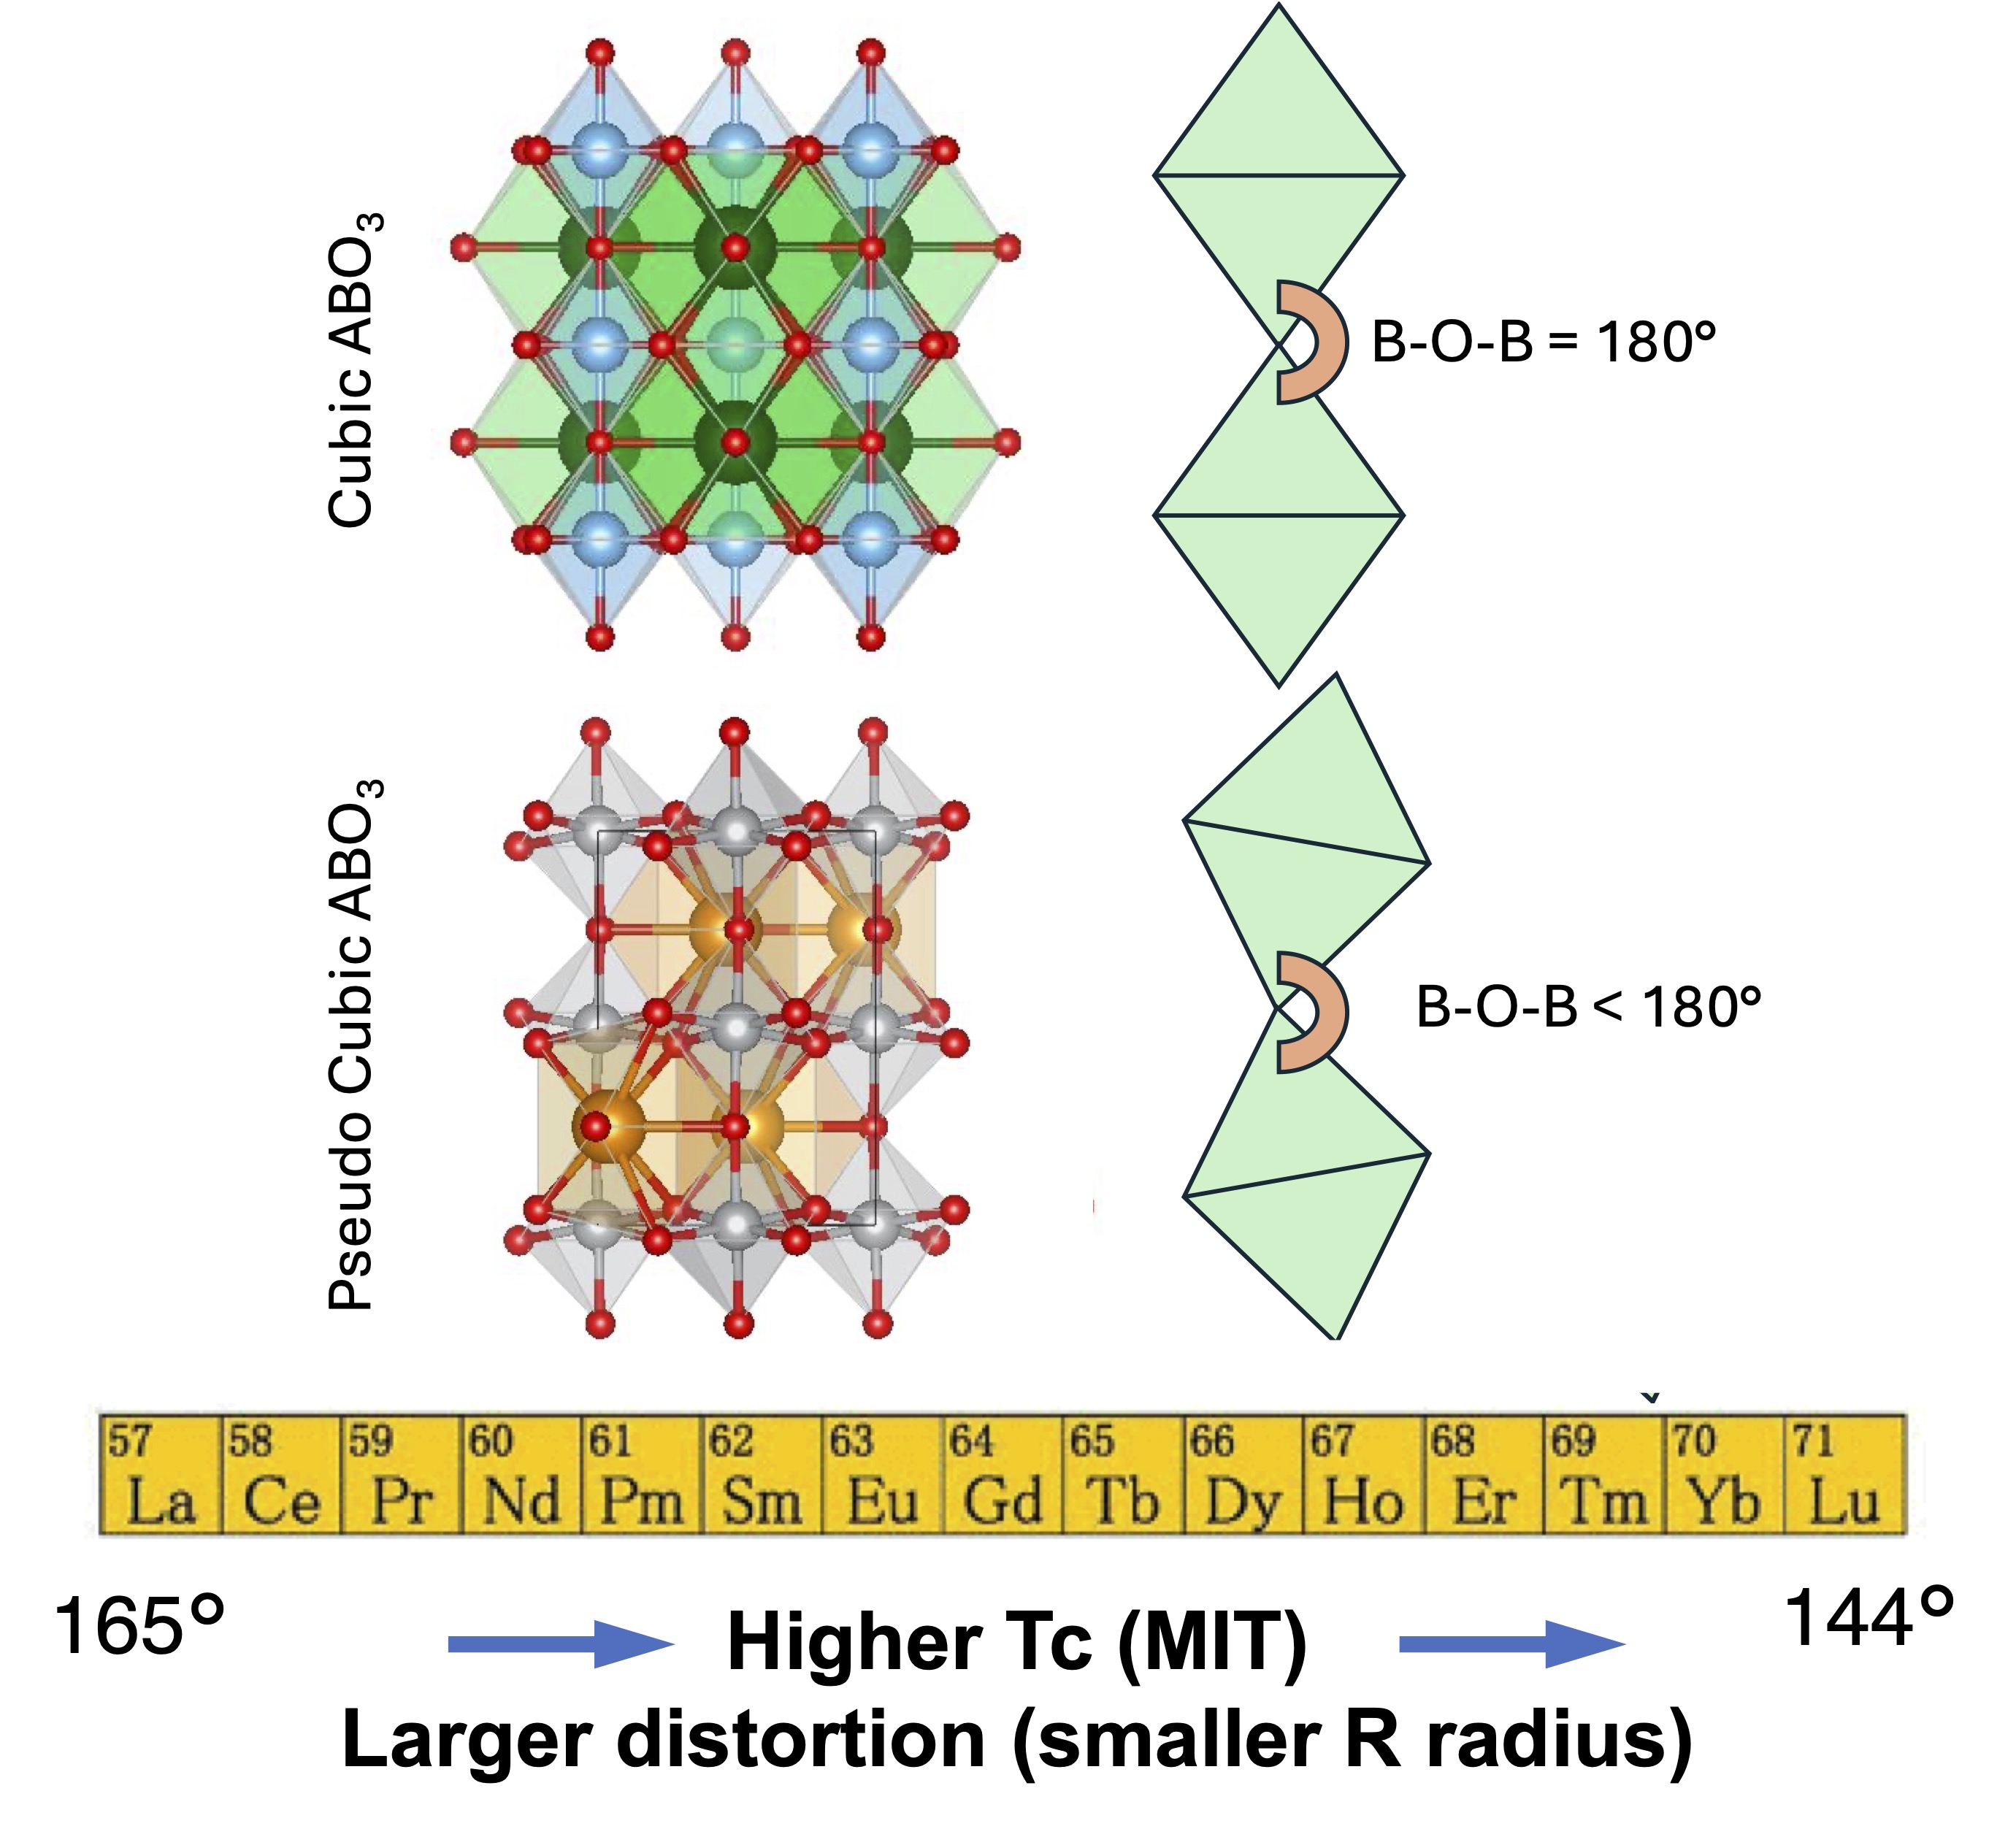 Fig. 1. Nature of the pseudo-cubic distortion in RNiO3 (compare NiO, which is cubic): the pseudo-cubic distortion causes the B-O-B bond angle (B is Ni in this case) to deviate from the ideal 180◦. This distortion is influenced by the size of the R-ion: ions with less-filled f-orbitals tend to have a larger ionic radius. As the rare-earth ionic radius increases, the degree of pseudo-cubic distortion decreases. Although there is a correlation between the metal-insulator transition (MIT) temperature and the extent of pseudo-cubic distortion, the orthorhombic Pbnm phase alone is not sufficient to support an insulating state. Achieving insulation requires an additional reduction in crystal symmetry beyond the Pbnm structure.
In all but La of the RNiO3 series, three distinct transitions are seen as the temperature is varied: a structural transition where symmetry is lowered from Pbnm to P21/n; a metal-insulator transition (MIT); and the onset of magnetic order. The first two often occur at same temperature, for that reason the dominant view has been that the MIT is driven by a structural transition.
This paper comes to a different conclusion: the transition is fundamentally driven by magnetic instabilities, with structure playing an enabling role. Such a “chicken and egg” controversy – when two phenomena occur together which is the cause and which the effect? – is seen in other systems too, such as VO2. The paper presents evidence to show that magnetization is the primary driving force for the MI transition, with an assist from symmetry lowering through structural distortions. One hint is the following. Ni’s natural nominal valence is 2+, corresponding to a d8 configuration, that is Ni strongly prefers to have a 8 d electrons, as is seen in e.g. NiO. In RNiO3, Ni is formally 3+, corresponding to d7. As this work shows, Ni disproportionates into a pairs of atoms with high-spin and low-spin configurations to ameliorate the unfavorable magnetic configuration dictated by d7.
Below two kinds of tests presented in the paper are summarized, that show how magnetism is the primary driving force. At the end we revisit the Pbnm phase to show that it strongly resembles a configurational average of the low-symmetry P21/n phase. This work uses the QSGW (quasiparticle self-consistent GW) approximation, a parameter-free many-body perturbation theory implemented in the Questaal code, to compute the electronic structure of seven RNiO3 compound, R = Lu, Yb, Tm, Er, Ho, Nd, Pr (to demonstrate the relative importance of lattice and magnetic structure we focus on NdNiO3). QSGW removes DFT starting-point dependence and has no model parameters, such as an adjustable Hubbard U. To disentangle the various contributions to the MIT, we consider also molecular statics and molecular dynamics using DFT, classical machine-learned interatomic potentials.
Before turning to the two tests, it is helpful to examine the high-symmetry Pbnm phase as a reference, to get some insight magnetism’s role. In Pbnm all Ni are equivalent, so there are only two magnetic possibilities: nonmagnetic and ferromagnetic. QSGW results for these two cases are shown in Fig. 2. In the NM case the relevant states around EF are Ni eg states, with a significant amount of O p mixed in. Introducing magnetism spin-splits the eg states, but a gap opens in one spin channel only.
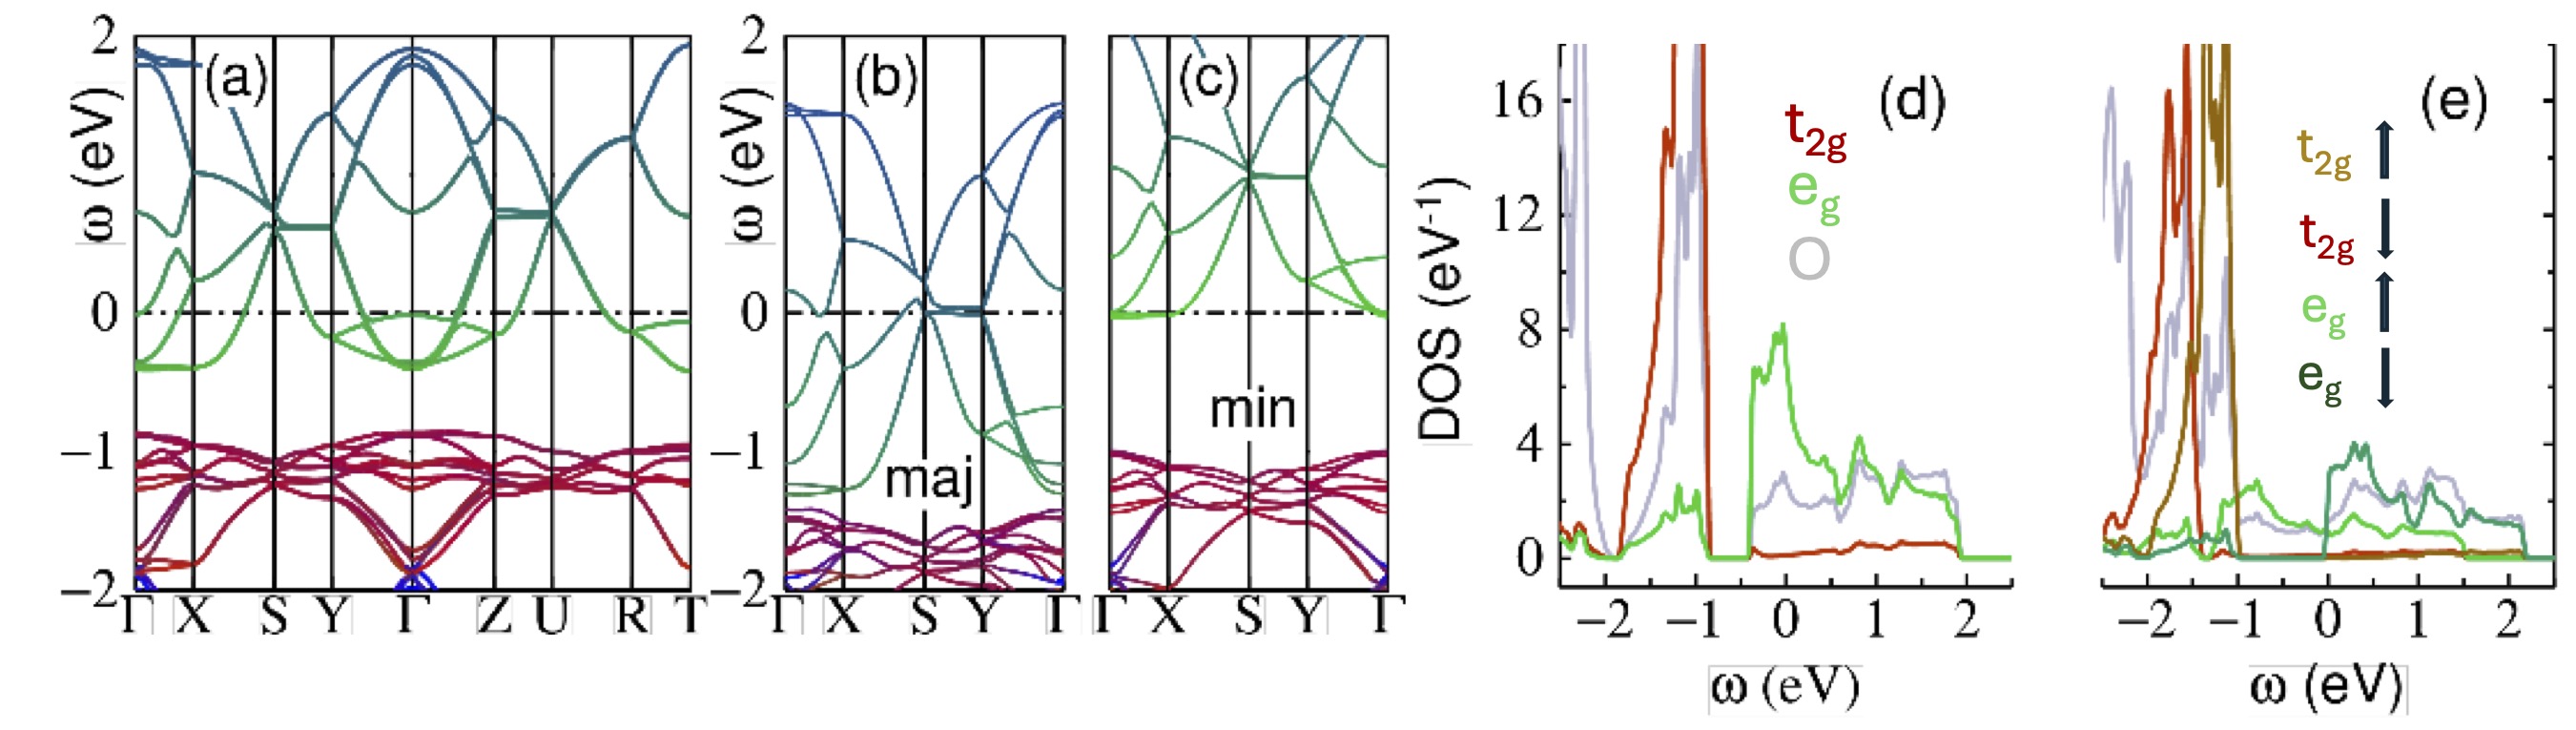 FIG. 2. NdNiO3 in the pseudocubic Pbnm phase. (a) energy bands in the nonmagnetic case. The Γ-S-Y lines deviate from mirror images of the Γ-Z-U lines because of deviations from cubic symmetry. Colors represent the following projections: Ni-t2g (red); Ni-eg (green); O-p (blue); thus the eg falls above the t2g. (b,c) energy bands in the ferromagnetic case for (majority, minority) spins. The bands are similar except t2g and eg are spin split, enabling a gap to form in the minority channel. (d) nonmagnetic density-of-states, showing the non-negligible amount of O character around EF=0. (e) FM density-of-states, showing how the majority and minority Ni d states are spin split by∼1 eV. To distinguish spins, colors are modified to: t2g (rust=majority, light-red=minority); eg (green=majority, olive=minority); O-p (cornflower blue).
Will a gap open up if the Ni become magnetically inequivalent? We can add site-local constraining Zeeman field ±B, to make the two Ni sites inequivalent. Result: a gap does open for most B in one or the other spin channel, but not both. The high-symmetry lattice never opens a gap in both channels. It does show that (artificially) imposing spin disproportionation can initiate the opening of an electronic bandgap.
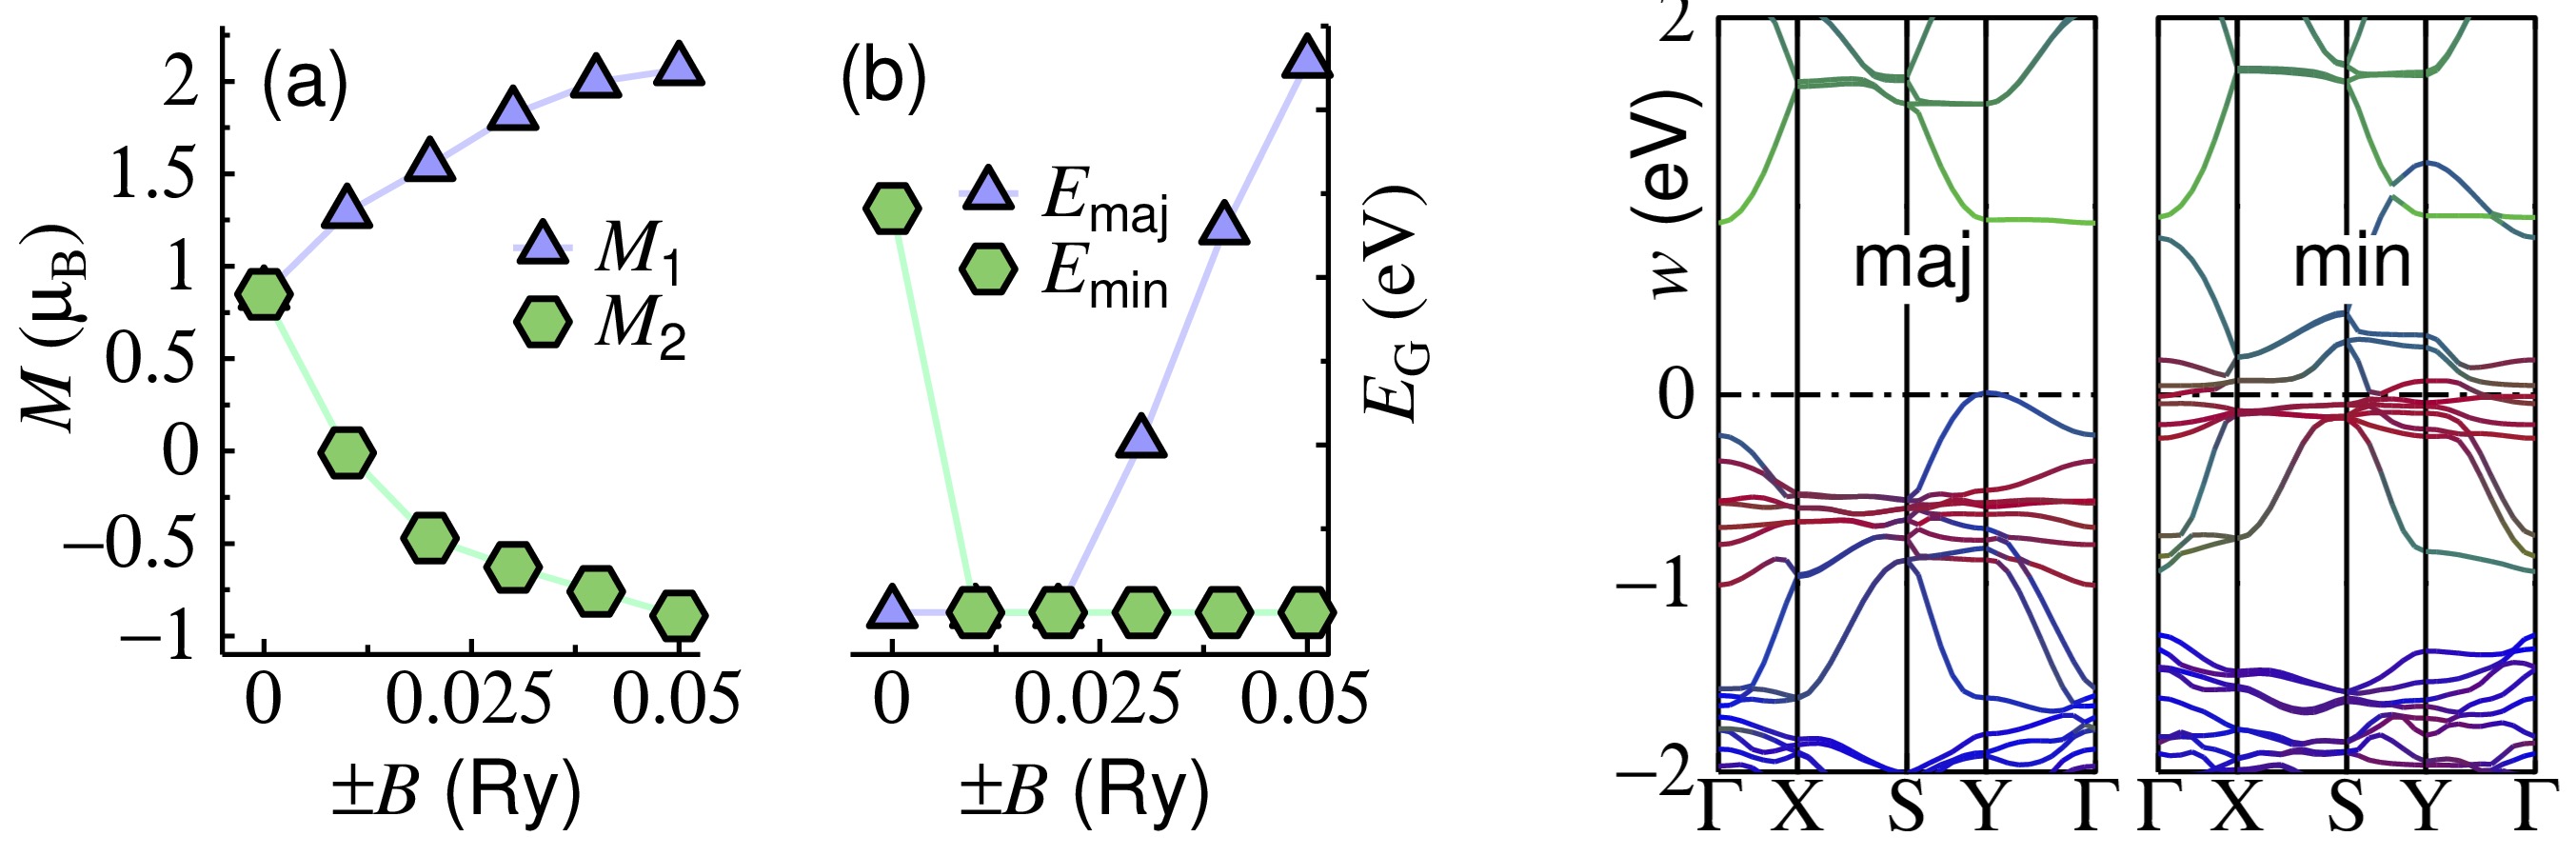 FIG. 3. Local magnetic moments (a) and bandgaps (b) of Pbnm NdNiO3 in the presence of a site-local constraining Zeeman field ±B. Right panels show energy bands for B = 0.04 Ry.
To fully open an electronic gap, structural distortions come to the rescue by breaking the degeneracy of the eg states (Fig. 4).
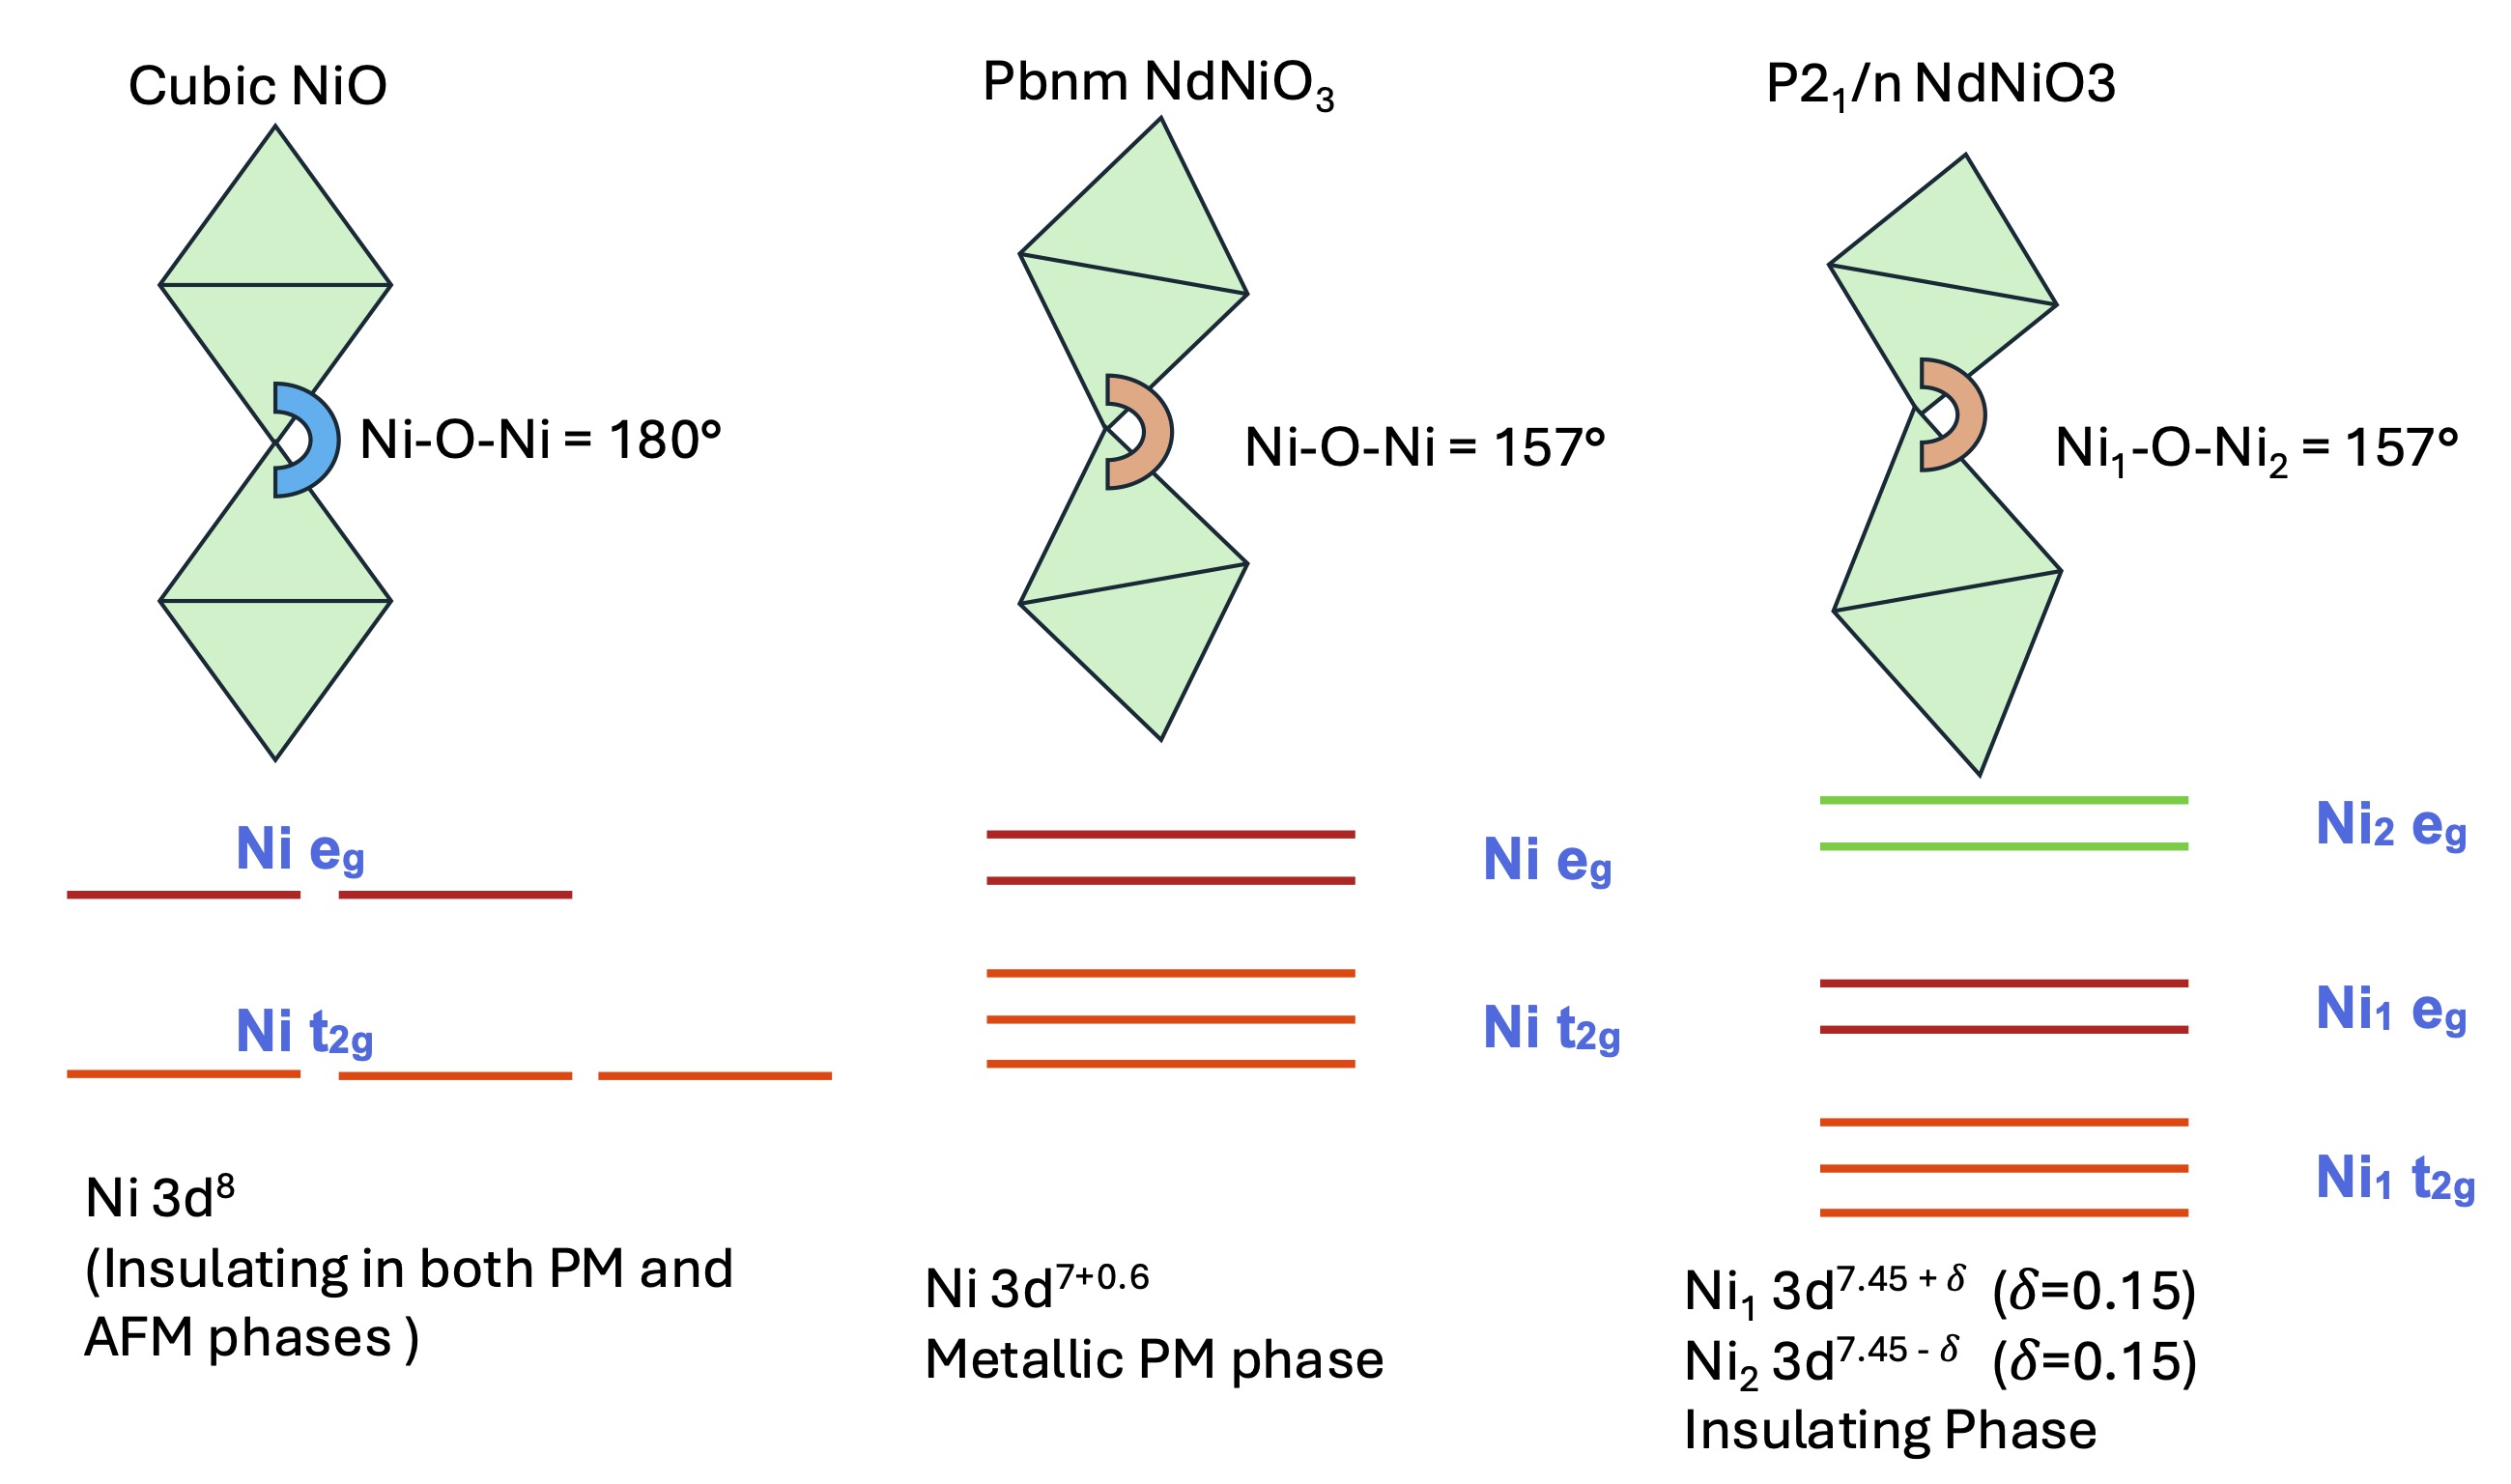 FIG. 4. Schematic representation of cubic, pseudo-cubic Pbnm and P21/n distortions: NiO appears in cubic crystal field and is insulating in both the paramagnetic and antiferromagnetic phases. NdNiO3 is a paramagnetic metal in the Pbnm phase and only becomes insulating in the P21/n phase with a concomitant charge, spin and bond disproportionation. Note that the Ni-O-Ni bond angle does not change on average in the Pbnm to P21/n distortion. The corresponding crystal field diagrams are also shown for all cases.
QSGW calculations show in detail how the Ni disproportionate and enable a gap to open. The lattice is allowed to relax under reduced P21/n symmetry, using DFT to obtain the relaxed structure. Relaxation causes two octahedra to become inequivalent (Fig. 4) making the Ni-O bond lengths different (Table 1). For the entire RNiO3 series, a gap slightly smaller than 1 eV opens. Remarkably the Ni disproportionate into a high-spin site with moment ~1.3 μB, and a fully nonmagnetic site.
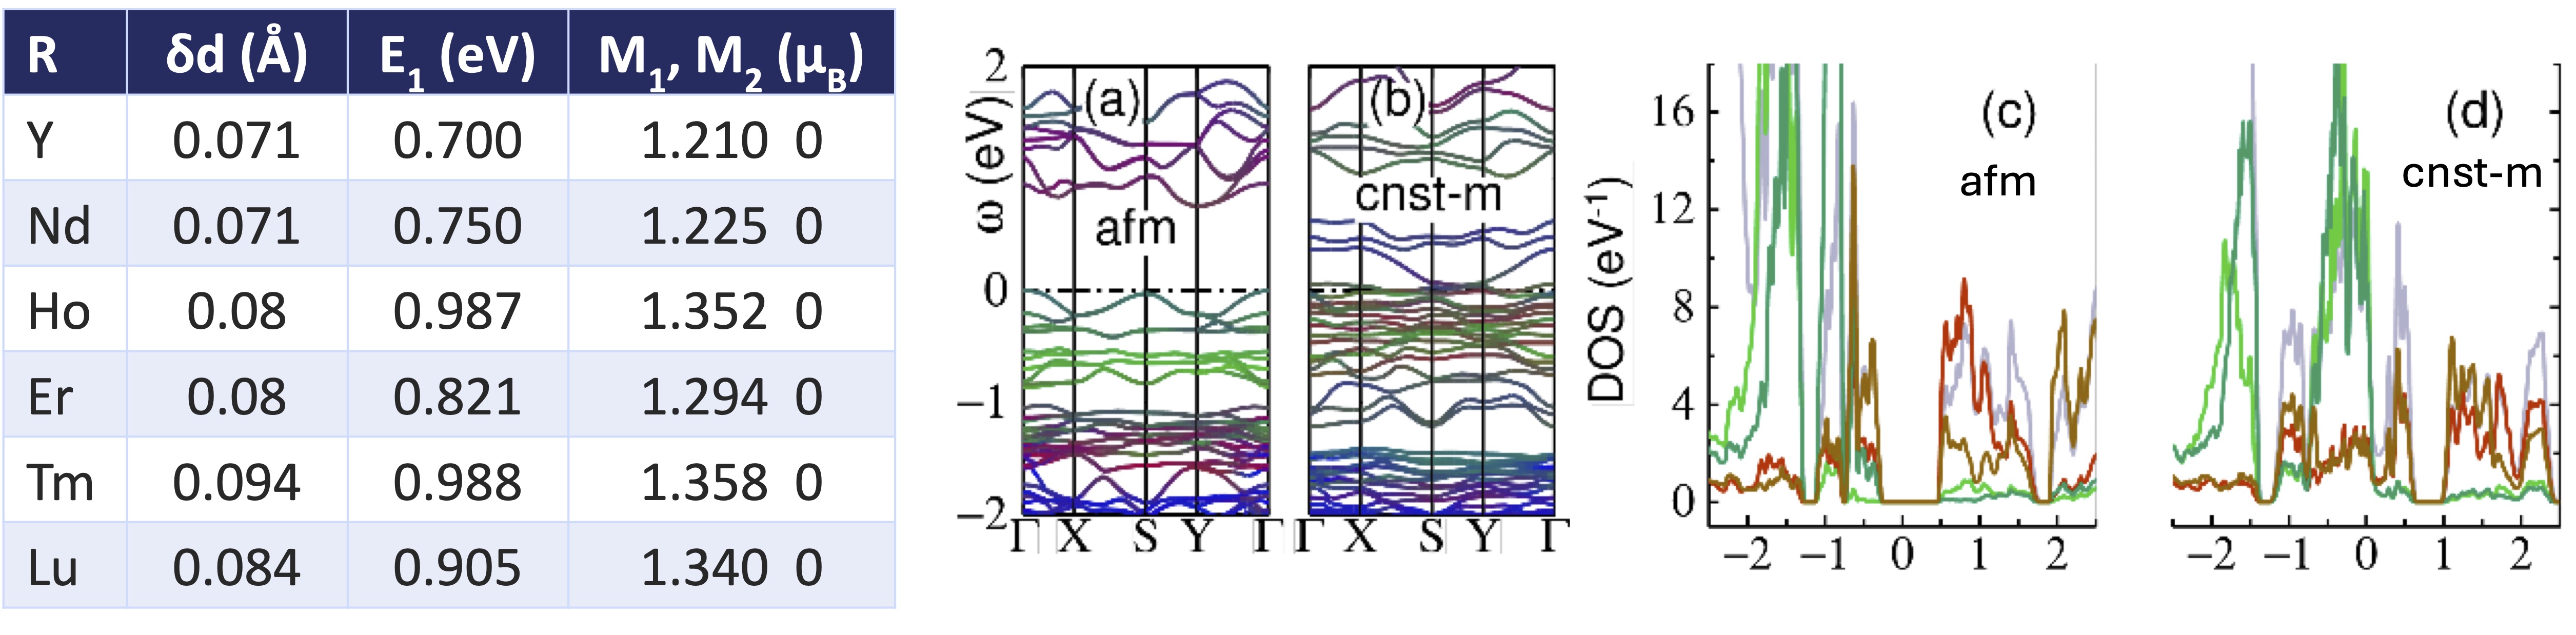 TABLE 1 and FIG 5. R-NiO3 in the P21/n phase, antiferromagnetic case. Table 1 shows the difference in Ni-O bond lengths for the two kinds of octahedra, the QSGW band gap, and the two Ni magnetic moments. The Ni in the smaller cage (Ni-2) is predicted to be nonmagnetic. Fig. 5 shows electronic features of AFM NdNiO3: (a) Energy bands in AFM phase, and (b) the AFM phase with additional constraining fields as described in the text. (In both cases up- and down- bands are nearly equivalent.) Colors represent the following projections: Ni-1 (red); Ni-2 (green); O-p(blue). In the unconstrained case, Ni-1 and Ni-2 have local moments ±1.22 μB and 0, respectively. In the constrained case, Ni-1 and Ni-2 all have approximate moments ±1.2 μB. (c,d) are the corresponding DOS. Colors represent the following projections: eg (rust=Ni-1, bright-red=Ni-2); t2g (olive=Ni-1, bright-green=Ni-2); O-p (cornflower blue).
Fig. 5(a) shows the band structure for NdNiO3 in the P21/n phase. A gap now opens between the eg states of the two distinct Ni sites, with Ni-1 forming the occupied states (red) and Ni-2 the unoccupied states (green). This is in sharp contrast to NiO where two Ni sites are equivalent.
To fully establish magnetism and magnetic disproportion are responsible for the MIT, we can augment the QSGW AFM solution by constraining all Ni sites to carry similar magnetic moments, while keeping the breathing-mode bond distortion fixed. The result is shown in Fig. 5b the insulating solution is destroyed, even though the structural distortion remains. The DOS (Fig 5d) shows that the Ni-1 and Ni-2 can no longer separate, and also that a fair amount of O-p is present at EF.
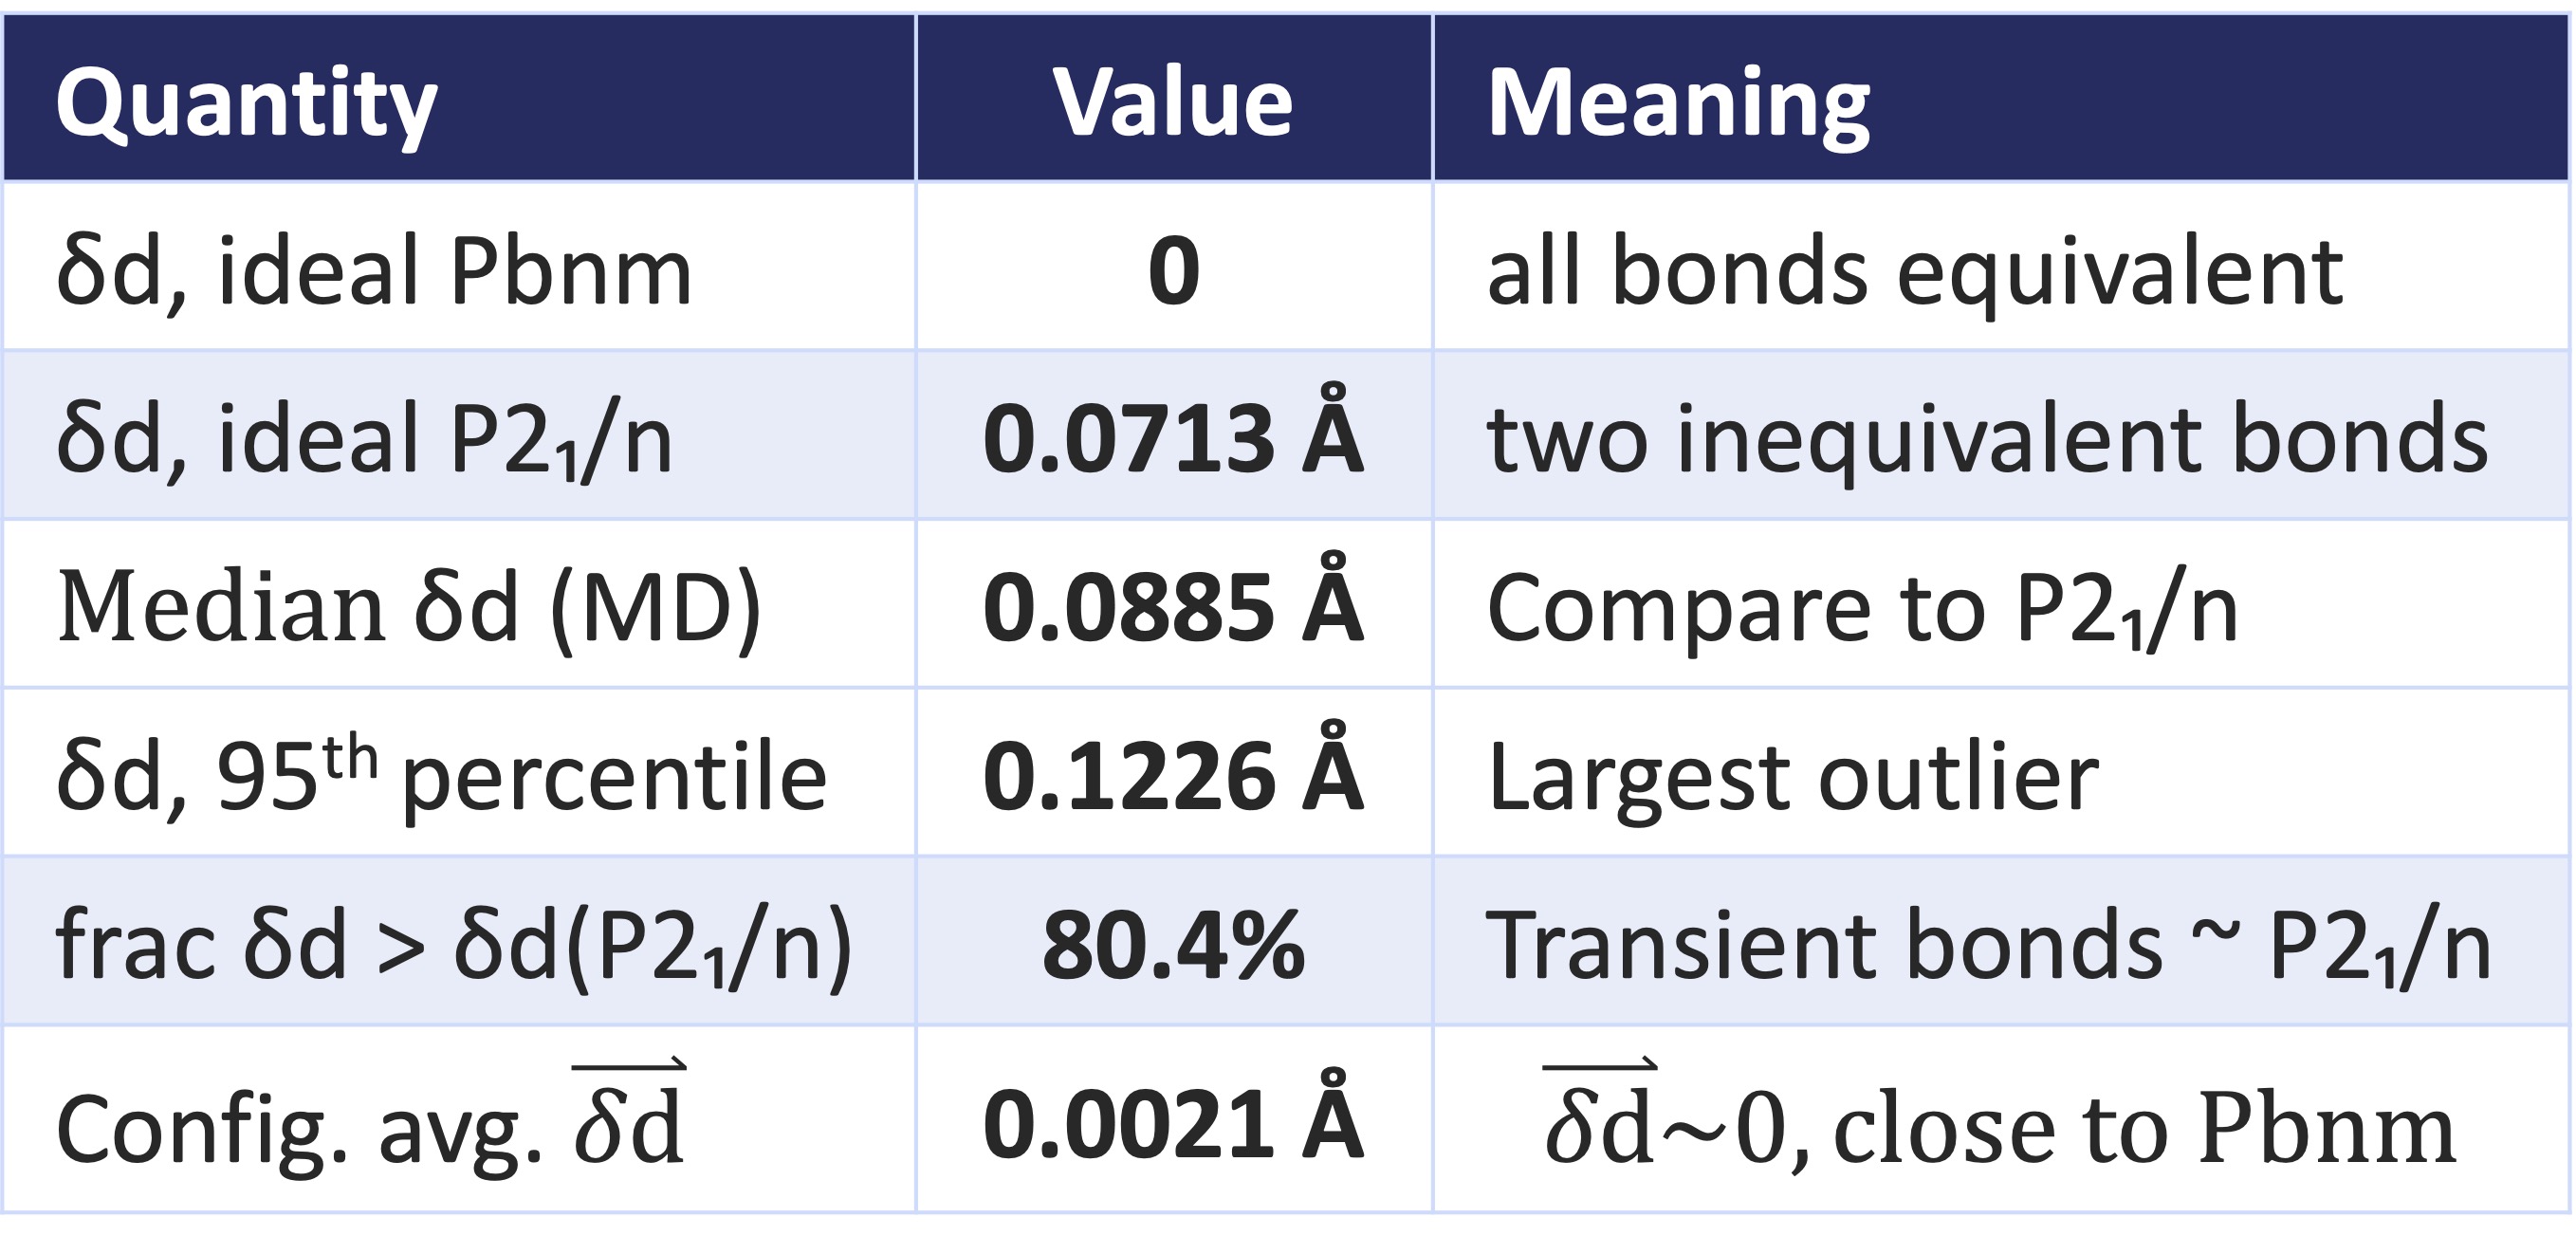 TABLE 2. Local Ni–O bond length disproportionation in the ideal Pbnm and The remaining lines are taken from configurational averages of an MD simulation. It shows the median absolution value ||, for the largest outliers, the fraction of configurations with at least as large as in the P21/n phase, and finally the configurationally averaged .
Finally the paper revisits the high-temperature Pbnm phase, using machine-learned molecular dynamics (MACE-MP foundation potential) on an 80-atom NdNiO3 supercell. The MD reveal that even a nominal Pbnm structure dynamically samples local Ni–O bond disproportionation comparable in magnitude to the static P21/n, while remaining Pbnm on average (Table 2). Said another way the system is Pbnm only on average () but at any instant, most of the material closely resembles the ideal P21/n phase (measured by ).
Conclusions
At low temperature, the insulating state in RNiO3 is most naturally understood as a magnetically driven instability, enabled by cage distortions breaking symmetry.
At high temperature, the local structure is closer to P21/n at any instant and only recovers Pbnm on average. This suggests many regions are locally insulating, while other regions are metallic.
METAL-INSULATOR TRANSITION · MAGNETISM · MOLECULAR DYNAMICS · MANY BODY PERTURBATION THEORY